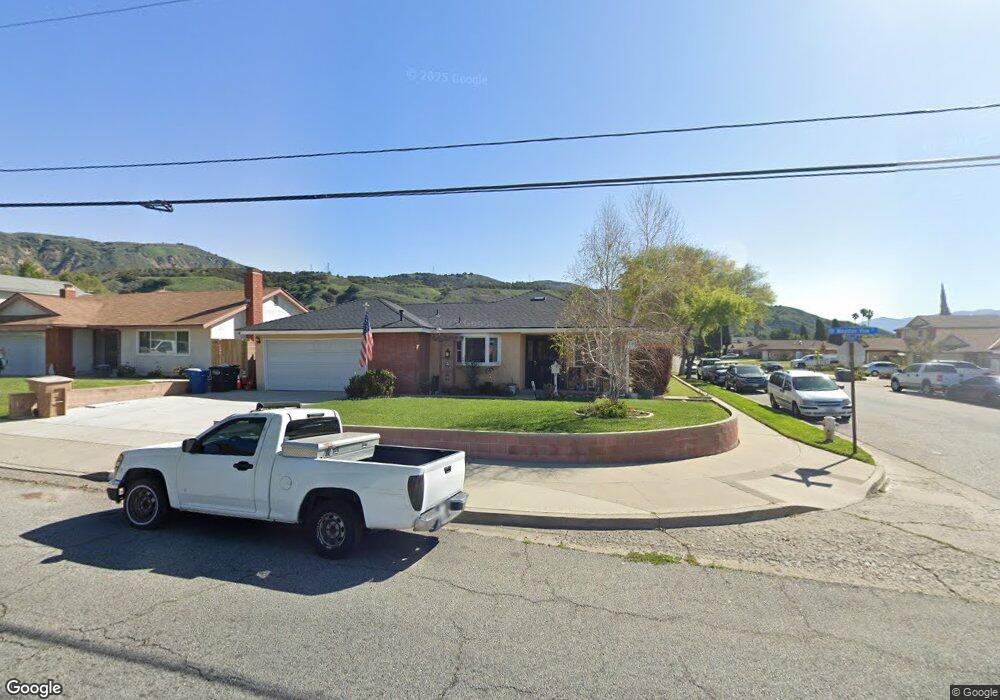
430 Mountain View St Fillmore, CA 93015
Estimated Value: $619,000 - $674,000
3
Beds
2
Baths
1,279
Sq Ft
$499/Sq Ft
Est. Value
About This Home
This home is located at 430 Mountain View St, Fillmore, CA 93015 and is currently estimated at $638,097, approximately $498 per square foot. 430 Mountain View St is a home located in Ventura County with nearby schools including San Cayetano Elementary School and Fillmore Senior High.
Ownership History
Date
Name
Owned For
Owner Type
Purchase Details
Closed on
Sep 26, 2008
Sold by
Jackson David R
Bought by
Hernandez Adrian and Hernandez Pamela
Current Estimated Value
Home Financials for this Owner
Home Financials are based on the most recent Mortgage that was taken out on this home.
Original Mortgage
$8,400
Outstanding Balance
$5,465
Interest Rate
5.9%
Mortgage Type
Second Mortgage Made To Cover Down Payment
Estimated Equity
$632,632
Purchase Details
Closed on
Apr 21, 2003
Sold by
Jackson David R and Jackson Anita D
Bought by
Jackson David R and Jackson Anita D
Home Financials for this Owner
Home Financials are based on the most recent Mortgage that was taken out on this home.
Original Mortgage
$82,000
Interest Rate
5.6%
Purchase Details
Closed on
Mar 10, 2003
Sold by
Jackson David R and Jackson Anita D
Bought by
Jackson David R and Jackson Anita D
Home Financials for this Owner
Home Financials are based on the most recent Mortgage that was taken out on this home.
Original Mortgage
$82,000
Interest Rate
5.6%
Purchase Details
Closed on
Apr 25, 2000
Sold by
Jackson David R and Jackson Anita D
Bought by
Jackson David R and Jackson Anita D
Create a Home Valuation Report for This Property
The Home Valuation Report is an in-depth analysis detailing your home's value as well as a comparison with similar homes in the area
Home Values in the Area
Average Home Value in this Area
Purchase History
| Date | Buyer | Sale Price | Title Company |
|---|---|---|---|
| Hernandez Adrian | $280,000 | Fidelity National Title | |
| Jackson David R | -- | -- | |
| Jackson David R | -- | Old Republic Title Ins Co | |
| Jackson David R | -- | -- |
Source: Public Records
Mortgage History
| Date | Status | Borrower | Loan Amount |
|---|---|---|---|
| Open | Hernandez Adrian | $8,400 | |
| Previous Owner | Hernandez Adrian | $274,995 | |
| Previous Owner | Jackson David R | $82,000 |
Source: Public Records
Tax History
| Year | Tax Paid | Tax Assessment Tax Assessment Total Assessment is a certain percentage of the fair market value that is determined by local assessors to be the total taxable value of land and additions on the property. | Land | Improvement |
|---|---|---|---|---|
| 2025 | $3,928 | $360,557 | $234,365 | $126,192 |
| 2024 | $3,928 | $353,488 | $229,770 | $123,718 |
| 2023 | $3,874 | $346,557 | $225,264 | $121,293 |
| 2022 | $3,579 | $339,762 | $220,847 | $118,915 |
| 2021 | $4,070 | $333,100 | $216,516 | $116,584 |
| 2020 | $3,774 | $329,687 | $214,297 | $115,390 |
| 2019 | $3,784 | $323,224 | $210,096 | $113,128 |
| 2018 | $3,707 | $316,887 | $205,977 | $110,910 |
| 2017 | $3,727 | $310,675 | $201,939 | $108,736 |
| 2016 | $3,449 | $304,584 | $197,980 | $106,604 |
| 2015 | $3,352 | $300,010 | $195,007 | $105,003 |
| 2014 | $3,072 | $270,000 | $175,000 | $95,000 |
Source: Public Records
Map
Nearby Homes
- 318 Bard St
- 616 Island View St
- 404 Central Ave
- 639 Mountain View St
- 340 Central Ave
- 252 Driftwood St
- 199 Rosewood St
- 345 Blaine Ave
- 81 Wildwood Ln
- 309 Heritage Valley Pkwy
- 458 Edgewood Dr
- 513 Heritage Valley Pkwy
- 549 Heritage Valley Pkwy
- 809 Woodgrove Rd
- 578 Apricot Ln
- 915 E Telegraph Rd
- 250 E Telegraph Rd Unit 200
- 250 E Telegraph Rd Unit 68
- 250 E Telegraph Rd Unit 135
- 250 E Telegraph Rd Unit 213
- 438 Mountain View St
- 433 Market St
- 439 Market St
- 444 Mountain View St
- 260 Casner Way
- 448 Mountain View St
- 254 Casner Way
- 445 Market St
- 433 Mountain View St
- 437 Mountain View St
- 248 Casner Way
- 427 Mountain View St
- 450 Mountain View St
- 441 Mountain View St
- 421 Mountain View St
- 451 Market St
- 445 Mountain View St
- 417 Mountain View St
- 237 Casner Way
- 242 Casner Way
Your Personal Tour Guide
Ask me questions while you tour the home.