Estimated Value: $445,000 - $510,594
3
Beds
2
Baths
1,689
Sq Ft
$285/Sq Ft
Est. Value
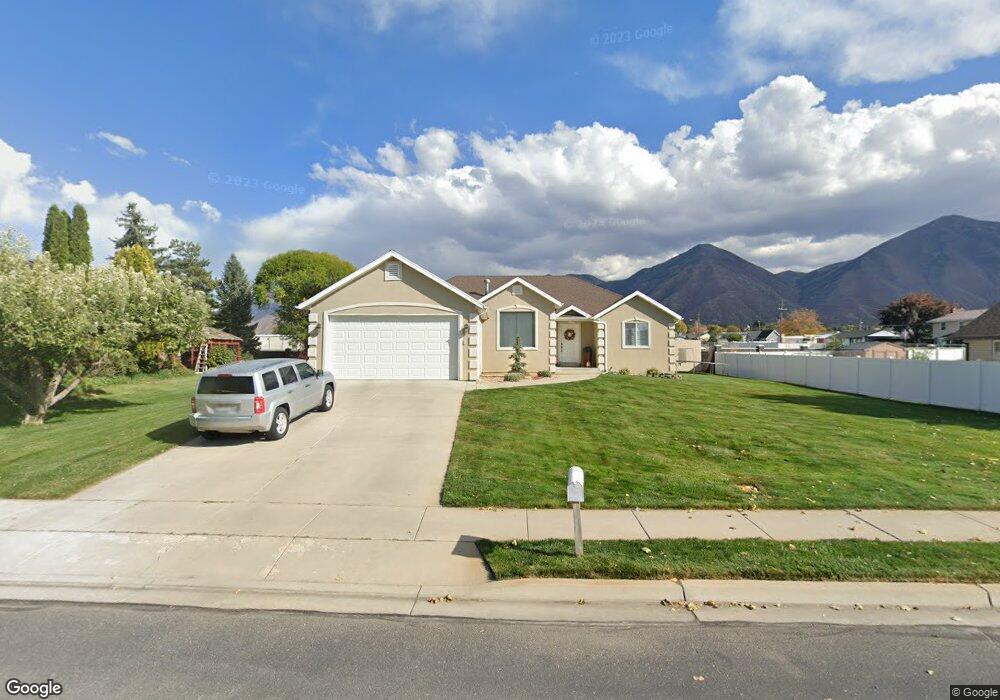
About This Home
This home is located at 430 N Main St, Salem, UT 84653 and is currently estimated at $481,531, approximately $285 per square foot. 430 N Main St is a home located in Utah County with nearby schools including Salem Elementary, Salem Junior High School, and Valley View Middle School.
Ownership History
Date
Name
Owned For
Owner Type
Purchase Details
Closed on
Jun 25, 2003
Sold by
Peterson Scott
Bought by
Peterson Scott N
Current Estimated Value
Home Financials for this Owner
Home Financials are based on the most recent Mortgage that was taken out on this home.
Original Mortgage
$148,000
Interest Rate
5.37%
Mortgage Type
Purchase Money Mortgage
Purchase Details
Closed on
Aug 29, 2002
Sold by
Peterson Scott N
Bought by
Peterson Scott
Home Financials for this Owner
Home Financials are based on the most recent Mortgage that was taken out on this home.
Original Mortgage
$147,000
Interest Rate
6.29%
Purchase Details
Closed on
Apr 20, 2000
Sold by
Peterson Neil and Atwood Kathleen Peterson
Bought by
Peterson Scott N
Home Financials for this Owner
Home Financials are based on the most recent Mortgage that was taken out on this home.
Original Mortgage
$148,000
Interest Rate
8.25%
Mortgage Type
Construction
Create a Home Valuation Report for This Property
The Home Valuation Report is an in-depth analysis detailing your home's value as well as a comparison with similar homes in the area
Home Values in the Area
Average Home Value in this Area
Purchase History
| Date | Buyer | Sale Price | Title Company |
|---|---|---|---|
| Peterson Scott N | -- | Horizon Title | |
| Peterson Scott | -- | Horizon Title | |
| Peterson Scott N | -- | Summit Title Co |
Source: Public Records
Mortgage History
| Date | Status | Borrower | Loan Amount |
|---|---|---|---|
| Closed | Peterson Scott N | $148,000 | |
| Closed | Peterson Scott | $147,000 | |
| Closed | Peterson Scott N | $148,000 |
Source: Public Records
Tax History
| Year | Tax Paid | Tax Assessment Tax Assessment Total Assessment is a certain percentage of the fair market value that is determined by local assessors to be the total taxable value of land and additions on the property. | Land | Improvement |
|---|---|---|---|---|
| 2025 | $2,388 | $255,310 | -- | -- |
| 2024 | $2,388 | $242,220 | $0 | $0 |
| 2023 | $2,430 | $246,895 | $0 | $0 |
| 2022 | $2,362 | $236,280 | $0 | $0 |
| 2021 | $1,933 | $310,300 | $87,100 | $223,200 |
| 2020 | $1,855 | $289,800 | $79,200 | $210,600 |
| 2019 | $1,796 | $286,400 | $75,800 | $210,600 |
| 2018 | $1,653 | $252,000 | $68,900 | $183,100 |
| 2017 | $1,555 | $126,390 | $0 | $0 |
| 2016 | $1,384 | $111,210 | $0 | $0 |
| 2015 | $1,251 | $98,780 | $0 | $0 |
| 2014 | $1,250 | $98,780 | $0 | $0 |
Source: Public Records
Map
Nearby Homes
- 144 W 590 N Unit 26
- 14 W 590 N
- 14 W 590 N Unit 19
- 253 N 100 E
- 191 E 560 N
- 16 W 650 N Unit 1
- 685-1197 N 1850 E
- 689-1198 N 1850 E
- 52 W 650 N Unit 3
- 625 N 220 E
- 128 W 650 N
- 146 W 650 N
- 172 W 650 N
- 703 N 150 E
- 432 E 300 N Unit 12
- 685 N 220 E
- 1223 N 360 E Unit 129
- 1212 N 360 E Unit 132
- 1195 N 360 E Unit 127
- 1241 N 360 E Unit 130
Your Personal Tour Guide
Ask me questions while you tour the home.