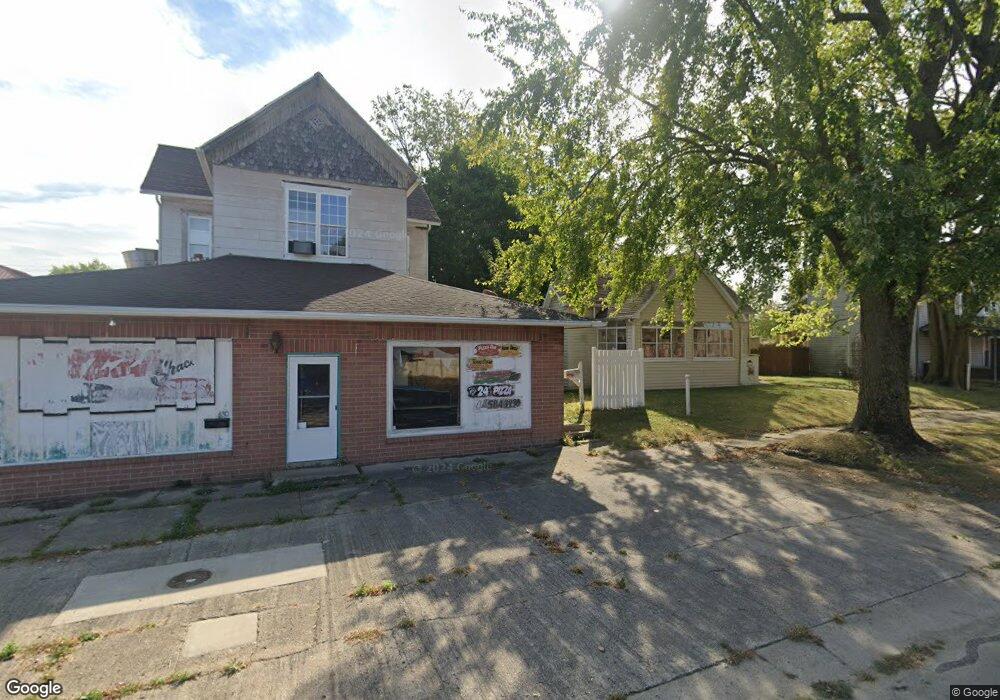
430 N Main St Unit 432 N MAIN STREET Winchester, IN 47394
Estimated Value: $32,000 - $136,000
2
Beds
2
Baths
2,320
Sq Ft
$39/Sq Ft
Est. Value
About This Home
This home is located at 430 N Main St Unit 432 N MAIN STREET, Winchester, IN 47394 and is currently estimated at $91,342, approximately $39 per square foot. 430 N Main St Unit 432 N MAIN STREET is a home located in Randolph County with nearby schools including Winchester Community High School.
Ownership History
Date
Name
Owned For
Owner Type
Purchase Details
Closed on
Nov 27, 2015
Sold by
Norton Ronald R and Norton Gale L
Bought by
Dawning Management Llc
Current Estimated Value
Purchase Details
Closed on
Jul 18, 2007
Sold by
Lovell Steven and Lovell Sherry
Bought by
Ramer Rachel
Home Financials for this Owner
Home Financials are based on the most recent Mortgage that was taken out on this home.
Original Mortgage
$46,400
Interest Rate
6.54%
Mortgage Type
Purchase Money Mortgage
Create a Home Valuation Report for This Property
The Home Valuation Report is an in-depth analysis detailing your home's value as well as a comparison with similar homes in the area
Home Values in the Area
Average Home Value in this Area
Purchase History
| Date | Buyer | Sale Price | Title Company |
|---|---|---|---|
| Dawning Management Llc | -- | None Available | |
| Ramer Rachel | -- | None Available |
Source: Public Records
Mortgage History
| Date | Status | Borrower | Loan Amount |
|---|---|---|---|
| Previous Owner | Ramer Rachel | $46,400 |
Source: Public Records
Tax History Compared to Growth
Tax History
| Year | Tax Paid | Tax Assessment Tax Assessment Total Assessment is a certain percentage of the fair market value that is determined by local assessors to be the total taxable value of land and additions on the property. | Land | Improvement |
|---|---|---|---|---|
| 2024 | $975 | $42,500 | $7,800 | $34,700 |
| 2023 | $975 | $42,500 | $7,800 | $34,700 |
| 2022 | $949 | $41,100 | $7,100 | $34,000 |
| 2021 | $961 | $42,100 | $7,800 | $34,300 |
| 2020 | $961 | $42,100 | $7,800 | $34,300 |
| 2019 | $961 | $42,100 | $7,800 | $34,300 |
| 2018 | $961 | $42,100 | $7,800 | $34,300 |
| 2017 | $946 | $41,500 | $7,800 | $33,700 |
| 2016 | $1,391 | $59,100 | $7,800 | $51,300 |
| 2014 | $1,431 | $61,600 | $8,400 | $53,200 |
| 2013 | $1,431 | $59,800 | $8,400 | $51,400 |
Source: Public Records
Map
Nearby Homes
- 544 N Main St
- 508 N West St
- 317 E North St
- 501 N Maple St
- Multiple Adresses Unit See Remarks
- 521 E Short St
- 326 S Meridian St
- 625 E Beech St
- TBD Progress Blvd
- 424 E South St
- 527 W South St
- 706 W Washington St
- 410 E Thompson St
- 622 W South St
- 504 S Meridian St
- 114 E Orange St
- 315 W Orange St
- 613 S Main St
- 742 S Huntsville Rd
- 803 S Beeson Dr