430 N Mallagh St Nipomo, CA 93444
Estimated Value: $748,000 - $794,000
4
Beds
2
Baths
2,097
Sq Ft
$365/Sq Ft
Est. Value
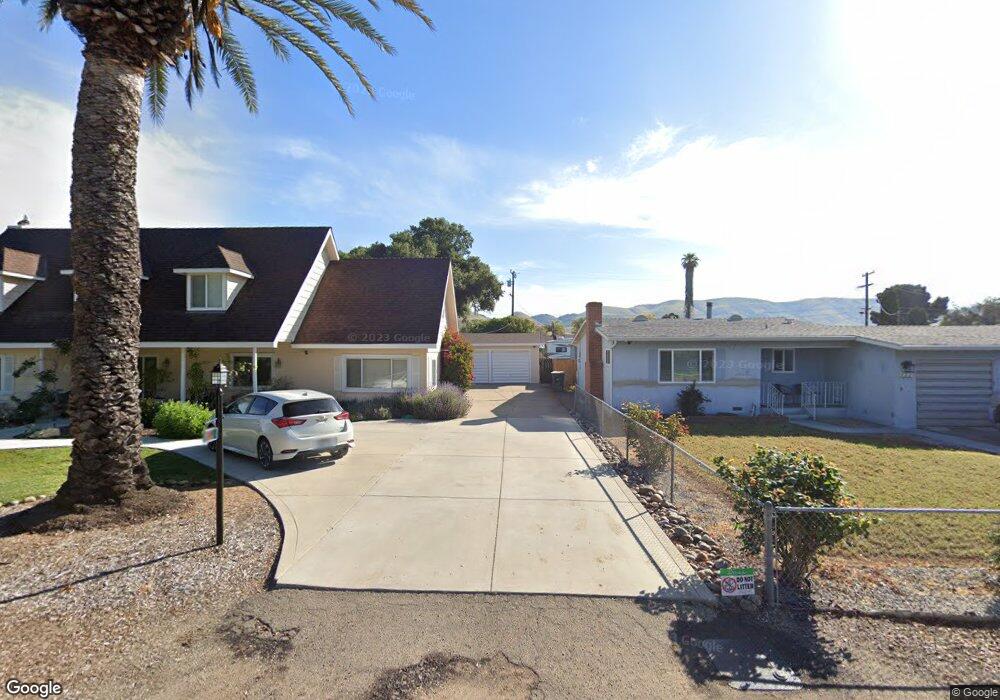
About This Home
This home is located at 430 N Mallagh St, Nipomo, CA 93444 and is currently estimated at $765,579, approximately $365 per square foot. 430 N Mallagh St is a home located in San Luis Obispo County with nearby schools including Nipomo Elementary School, Mesa Middle School, and Nipomo High School.
Ownership History
Date
Name
Owned For
Owner Type
Purchase Details
Closed on
Jul 2, 2009
Sold by
Stroup David E
Bought by
Woodward Laurie R
Current Estimated Value
Home Financials for this Owner
Home Financials are based on the most recent Mortgage that was taken out on this home.
Original Mortgage
$233,000
Interest Rate
5.25%
Mortgage Type
New Conventional
Create a Home Valuation Report for This Property
The Home Valuation Report is an in-depth analysis detailing your home's value as well as a comparison with similar homes in the area
Home Values in the Area
Average Home Value in this Area
Purchase History
| Date | Buyer | Sale Price | Title Company |
|---|---|---|---|
| Woodward Laurie R | -- | Chicago Title Company |
Source: Public Records
Mortgage History
| Date | Status | Borrower | Loan Amount |
|---|---|---|---|
| Closed | Woodward Laurie R | $233,000 |
Source: Public Records
Tax History
| Year | Tax Paid | Tax Assessment Tax Assessment Total Assessment is a certain percentage of the fair market value that is determined by local assessors to be the total taxable value of land and additions on the property. | Land | Improvement |
|---|---|---|---|---|
| 2025 | $1,860 | $187,969 | $72,210 | $115,759 |
| 2024 | $1,837 | $184,285 | $70,795 | $113,490 |
| 2023 | $1,837 | $180,672 | $69,407 | $111,265 |
| 2022 | $1,808 | $177,131 | $68,047 | $109,084 |
| 2021 | $1,803 | $173,659 | $66,713 | $106,946 |
| 2020 | $1,782 | $171,879 | $66,029 | $105,850 |
| 2019 | $1,769 | $168,510 | $64,735 | $103,775 |
| 2018 | $1,747 | $165,207 | $63,466 | $101,741 |
| 2017 | $1,713 | $161,969 | $62,222 | $99,747 |
| 2016 | $1,614 | $158,794 | $61,002 | $97,792 |
| 2015 | $1,590 | $156,410 | $60,086 | $96,324 |
| 2014 | $1,529 | $153,347 | $58,909 | $94,438 |
Source: Public Records
Map
Nearby Homes
- 124 W Chestnut St
- 1 W Branch St
- 150 E Chestnut St
- 195 E Chestnut St
- 240 Dahlia St
- 267 W Tefft St
- 183 E Tefft St
- 189 E Tefft St
- 160 San Antonio Ln
- 195 E Tefft St
- 239 E Branch St
- 136 Clearwater Ln
- 247 E Branch St
- 0 S Burton St
- 90111003 W Price St
- 285 E Tefft St
- 449 W Tefft St
- 449 W Tefft St Unit 23
- 449 W Tefft St Unit 13
- 100 E Bennett St
Your Personal Tour Guide
Ask me questions while you tour the home.