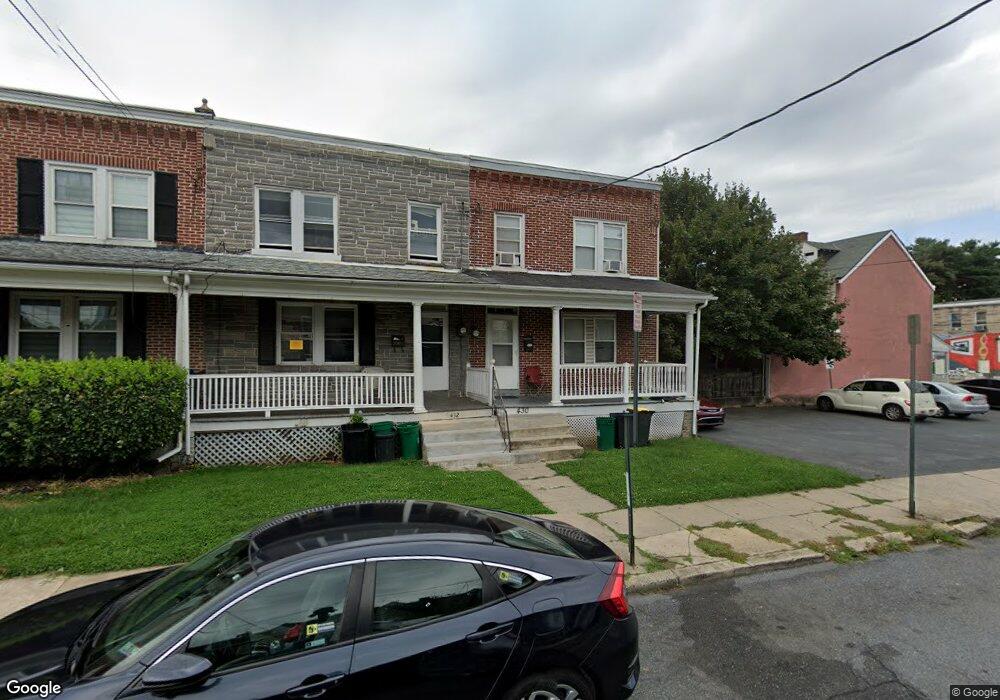
430 Pearl St Lancaster, PA 17603
West End NeighborhoodEstimated Value: $184,125 - $223,000
3
Beds
1
Bath
1,120
Sq Ft
$181/Sq Ft
Est. Value
About This Home
This home is located at 430 Pearl St, Lancaster, PA 17603 and is currently estimated at $202,531, approximately $180 per square foot. 430 Pearl St is a home located in Lancaster County with nearby schools including Smith-Wade-El Elementary School, Wheatland Middle School, and McCaskey High School.
Ownership History
Date
Name
Owned For
Owner Type
Purchase Details
Closed on
Nov 30, 2001
Sold by
Lutz Kenneth L and Lutz Lydia M
Bought by
Rodriguez Frankie and Shumate Michelle L
Current Estimated Value
Home Financials for this Owner
Home Financials are based on the most recent Mortgage that was taken out on this home.
Original Mortgage
$64,390
Outstanding Balance
$25,347
Interest Rate
6.67%
Mortgage Type
FHA
Estimated Equity
$177,184
Purchase Details
Closed on
May 16, 2001
Sold by
Lasalle National Bank
Bought by
Lutz Kenneth L and Lutz Lydia M
Home Financials for this Owner
Home Financials are based on the most recent Mortgage that was taken out on this home.
Original Mortgage
$46,900
Interest Rate
7.03%
Purchase Details
Closed on
Mar 28, 2001
Sold by
Nissley Daryl D
Bought by
Lasalle National Bank
Home Financials for this Owner
Home Financials are based on the most recent Mortgage that was taken out on this home.
Original Mortgage
$46,900
Interest Rate
7.03%
Create a Home Valuation Report for This Property
The Home Valuation Report is an in-depth analysis detailing your home's value as well as a comparison with similar homes in the area
Home Values in the Area
Average Home Value in this Area
Purchase History
| Date | Buyer | Sale Price | Title Company |
|---|---|---|---|
| Rodriguez Frankie | $64,900 | -- | |
| Lutz Kenneth L | $25,750 | -- | |
| Lasalle National Bank | -- | -- |
Source: Public Records
Mortgage History
| Date | Status | Borrower | Loan Amount |
|---|---|---|---|
| Open | Rodriguez Frankie | $64,390 | |
| Previous Owner | Lasalle National Bank | $46,900 |
Source: Public Records
Tax History Compared to Growth
Tax History
| Year | Tax Paid | Tax Assessment Tax Assessment Total Assessment is a certain percentage of the fair market value that is determined by local assessors to be the total taxable value of land and additions on the property. | Land | Improvement |
|---|---|---|---|---|
| 2025 | $3,122 | $78,900 | $20,400 | $58,500 |
| 2024 | $3,122 | $78,900 | $20,400 | $58,500 |
| 2023 | $3,070 | $78,900 | $20,400 | $58,500 |
| 2022 | $2,942 | $78,900 | $20,400 | $58,500 |
| 2021 | $2,879 | $78,900 | $20,400 | $58,500 |
| 2020 | $2,879 | $78,900 | $20,400 | $58,500 |
| 2019 | $2,836 | $78,900 | $20,400 | $58,500 |
| 2018 | $1,683 | $78,900 | $20,400 | $58,500 |
| 2017 | $3,316 | $72,200 | $23,600 | $48,600 |
| 2016 | $3,286 | $72,200 | $23,600 | $48,600 |
| 2015 | $1,282 | $72,200 | $23,600 | $48,600 |
| 2014 | $2,868 | $72,200 | $23,600 | $48,600 |
Source: Public Records
Map
Nearby Homes