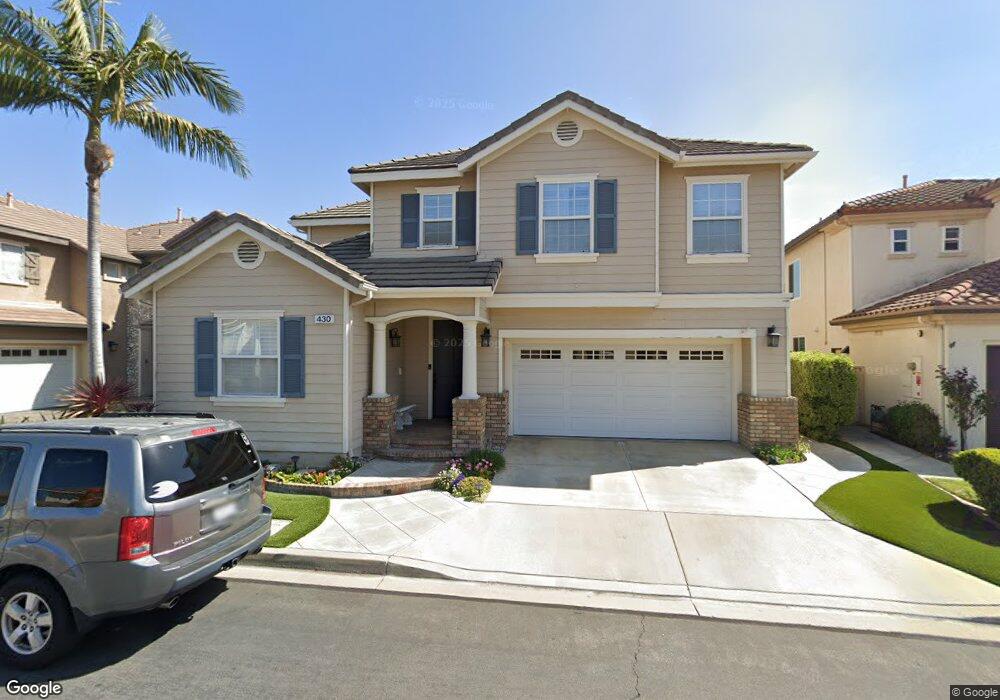
430 Quail Run Ln Placentia, CA 92870
Estimated Value: $1,504,000 - $1,681,000
5
Beds
3
Baths
3,178
Sq Ft
$492/Sq Ft
Est. Value
About This Home
This home is located at 430 Quail Run Ln, Placentia, CA 92870 and is currently estimated at $1,564,677, approximately $492 per square foot. 430 Quail Run Ln is a home located in Orange County with nearby schools including John O. Tynes Elementary School, Kraemer Middle School, and Valencia High School.
Ownership History
Date
Name
Owned For
Owner Type
Purchase Details
Closed on
Jun 18, 2003
Sold by
Johnson Mark S and Johnson Ann M
Bought by
Waugh Matthew N and Waugh Heather A
Current Estimated Value
Home Financials for this Owner
Home Financials are based on the most recent Mortgage that was taken out on this home.
Original Mortgage
$320,000
Outstanding Balance
$133,752
Interest Rate
5.15%
Mortgage Type
Purchase Money Mortgage
Estimated Equity
$1,430,925
Purchase Details
Closed on
May 13, 2002
Sold by
Osborn James P and Osborn Christine D
Bought by
Johnson Mark S and Johnson Ann M
Home Financials for this Owner
Home Financials are based on the most recent Mortgage that was taken out on this home.
Original Mortgage
$370,000
Interest Rate
6%
Purchase Details
Closed on
Feb 22, 2001
Sold by
Osborn James P and Osborn Christine D
Bought by
Osborn James P and Osborn Christine D
Purchase Details
Closed on
Aug 17, 1999
Sold by
Placentia #117 Lp
Bought by
Osborn James P and Osborn Christi D
Home Financials for this Owner
Home Financials are based on the most recent Mortgage that was taken out on this home.
Original Mortgage
$327,900
Interest Rate
7.12%
Create a Home Valuation Report for This Property
The Home Valuation Report is an in-depth analysis detailing your home's value as well as a comparison with similar homes in the area
Home Values in the Area
Average Home Value in this Area
Purchase History
| Date | Buyer | Sale Price | Title Company |
|---|---|---|---|
| Waugh Matthew N | $640,000 | Fidelity Natl Title Ins Co | |
| Johnson Mark S | $570,000 | Fidelity National Title Ins | |
| Osborn James P | -- | -- | |
| Osborn James P | $410,000 | First American Title Ins Co |
Source: Public Records
Mortgage History
| Date | Status | Borrower | Loan Amount |
|---|---|---|---|
| Open | Waugh Matthew N | $320,000 | |
| Previous Owner | Johnson Mark S | $370,000 | |
| Previous Owner | Osborn James P | $327,900 | |
| Closed | Osborn James P | $40,980 |
Source: Public Records
Tax History Compared to Growth
Tax History
| Year | Tax Paid | Tax Assessment Tax Assessment Total Assessment is a certain percentage of the fair market value that is determined by local assessors to be the total taxable value of land and additions on the property. | Land | Improvement |
|---|---|---|---|---|
| 2025 | $10,408 | $909,797 | $389,548 | $520,249 |
| 2024 | $10,408 | $891,958 | $381,909 | $510,049 |
| 2023 | $10,209 | $874,469 | $374,420 | $500,049 |
| 2022 | $10,088 | $857,323 | $367,078 | $490,245 |
| 2021 | $9,871 | $840,513 | $359,880 | $480,633 |
| 2020 | $9,902 | $831,895 | $356,190 | $475,705 |
| 2019 | $9,521 | $815,584 | $349,206 | $466,378 |
| 2018 | $9,402 | $799,593 | $342,359 | $457,234 |
| 2017 | $9,246 | $783,915 | $335,646 | $448,269 |
| 2016 | $9,061 | $768,545 | $329,065 | $439,480 |
| 2015 | $8,949 | $757,001 | $324,122 | $432,879 |
| 2014 | $8,693 | $742,173 | $317,773 | $424,400 |
Source: Public Records
Map
Nearby Homes
- 988 Spyglass Place
- 1037 Davis Way
- 747 De Jesus Dr
- 1142 Soto Place
- 615 Jensen Place
- 1171 Curie Ln
- 549 Fordham Dr
- 1259 E Providence Loop
- 625 Patten Ave
- 1018 Violet Cir
- Elina Plan at Vista Rose
- Lyda Plan at Vista Rose
- Prairie Plan at Vista Rose
- Gallica Plan at Vista Rose
- 653 Patten Ave
- 707 Olivier Dr
- 921 Azalea Ave
- 582 Mcfadden St
- 704 Mcfadden St
- 714 Olivier Dr
- 424 Quail Run Ln
- 436 Quail Run Ln
- 443 Augusta Ln
- 418 Quail Run Ln
- 449 Augusta Ln
- 437 Augusta Ln
- 932 Torrey Pines Place
- 431 Augusta Ln
- 423 Quail Run Ln
- 412 Quail Run Ln
- 425 Augusta Ln
- 937 Torrey Pines Place
- 943 Torrey Pines Place
- 417 Quail Run Ln
- 926 Torrey Pines Place
- 931 Torrey Pines Place
- 949 Torrey Pines Place
- 419 Augusta Ln
- 406 Quail Run Ln
- 925 Torrey Pines Place