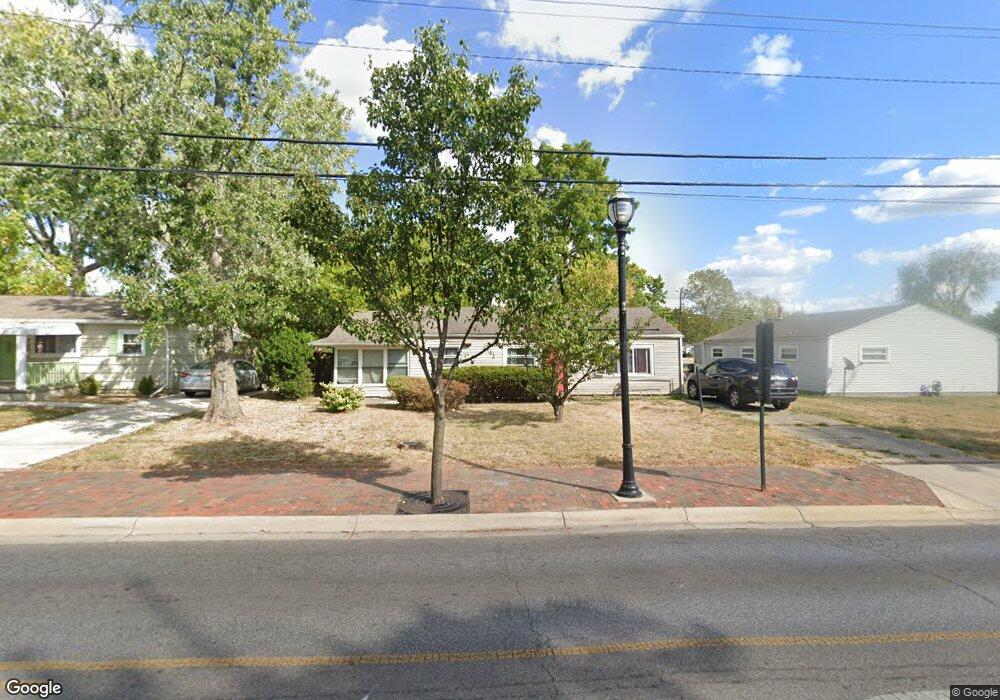
430 S Yearling Rd Columbus, OH 43213
Estimated Value: $207,000 - $248,000
2
Beds
2
Baths
1,620
Sq Ft
$138/Sq Ft
Est. Value
About This Home
This home is located at 430 S Yearling Rd, Columbus, OH 43213 and is currently estimated at $223,042, approximately $137 per square foot. 430 S Yearling Rd is a home located in Franklin County with nearby schools including Etna Road Elementary School, Beechwood Elementary School, and Rosemore Middle School.
Ownership History
Date
Name
Owned For
Owner Type
Purchase Details
Closed on
Dec 10, 2009
Sold by
Russo Realty Ltd
Bought by
Art Russo Properties Ltd
Current Estimated Value
Purchase Details
Closed on
May 13, 2005
Sold by
Russo Nancy A and Russo Arthur F
Bought by
Russo Realty Ltd
Purchase Details
Closed on
Dec 25, 1998
Sold by
Russo Richard and Russo Richard R
Bought by
Russo Julie
Purchase Details
Closed on
May 30, 1997
Sold by
Mazgay Edward L and Mazgay Michelle
Bought by
Russo Nancy A and Russo Richard R
Home Financials for this Owner
Home Financials are based on the most recent Mortgage that was taken out on this home.
Original Mortgage
$45,806
Interest Rate
7.99%
Mortgage Type
Seller Take Back
Purchase Details
Closed on
Oct 1, 1990
Bought by
Mazgay Edward L
Purchase Details
Closed on
May 30, 1907
Sold by
Mazgay Edward L and Mazgay Michelle
Bought by
Russo Nancy A and Russo Richard R
Create a Home Valuation Report for This Property
The Home Valuation Report is an in-depth analysis detailing your home's value as well as a comparison with similar homes in the area
Home Values in the Area
Average Home Value in this Area
Purchase History
| Date | Buyer | Sale Price | Title Company |
|---|---|---|---|
| Art Russo Properties Ltd | $89,700 | Foundation | |
| Russo Realty Ltd | -- | Castle Titl | |
| Russo Julie | -- | Foundation Title Agency Inc | |
| Russo Nancy A | $47,474 | Foundation Title Agency Inc | |
| Mazgay Edward L | $55,000 | -- | |
| Russo Nancy A | $47,500 | Foundation Title Agency Inc |
Source: Public Records
Mortgage History
| Date | Status | Borrower | Loan Amount |
|---|---|---|---|
| Previous Owner | Russo Nancy A | $45,806 |
Source: Public Records
Tax History Compared to Growth
Tax History
| Year | Tax Paid | Tax Assessment Tax Assessment Total Assessment is a certain percentage of the fair market value that is determined by local assessors to be the total taxable value of land and additions on the property. | Land | Improvement |
|---|---|---|---|---|
| 2024 | $3,207 | $71,650 | $15,260 | $56,390 |
| 2023 | $3,185 | $71,650 | $15,260 | $56,390 |
| 2022 | $2,359 | $40,320 | $6,790 | $33,530 |
| 2021 | $2,218 | $40,320 | $6,790 | $33,530 |
| 2020 | $2,197 | $40,320 | $6,790 | $33,530 |
| 2019 | $1,951 | $31,120 | $5,430 | $25,690 |
| 2018 | $1,917 | $31,120 | $5,430 | $25,690 |
| 2017 | $1,872 | $31,120 | $5,430 | $25,690 |
| 2016 | $1,829 | $27,230 | $5,110 | $22,120 |
| 2015 | $1,845 | $27,230 | $5,110 | $22,120 |
| 2014 | $1,845 | $27,230 | $5,110 | $22,120 |
| 2013 | $1,575 | $30,240 | $5,670 | $24,570 |
Source: Public Records
Map
Nearby Homes
- 4212 Seigman Ave
- 4368 Broadhurst Dr
- 4148 Elbern Ave
- 579 Westphal Ave
- 4232 Mayflower Blvd
- 451 Beaver Ave
- 4489 Saint Margaret Ln
- 571 S Hamilton Rd
- 798 S Yearling Rd
- 4653 Kae Ave
- 353 Shell Ct E
- 4662 Jae Ave
- 4094 E Main St
- 469 Cumberland Dr
- 91 Robinwood Ave
- 3814 Elbern Ave
- 4780 Etna Rd Unit 782
- 320 Collingwood Ave
- 4144 Mcallister Ave
- 963 Erickson Ave
- 424 S Yearling Rd
- 4306 Kumler Dr
- 4312 Kumler Dr
- 418 S Yearling Rd
- 431 Wolfe Ave
- 412 S Yearling Rd
- 423 Wolfe Ave
- 441 Wolfe Ave
- 444 S Yearling Rd
- 415 Wolfe Ave
- 4311 Kumler Dr
- 448 S Yearling Rd
- 409 Wolfe Ave
- 4319 Kumler Dr
- 408 S Yearling Rd
- 4327 Kumler Dr
- 440 Wolfe Ave
- 452 S Yearling Rd
- 425 S Yearling Rd
- 399 Wolfe Ave