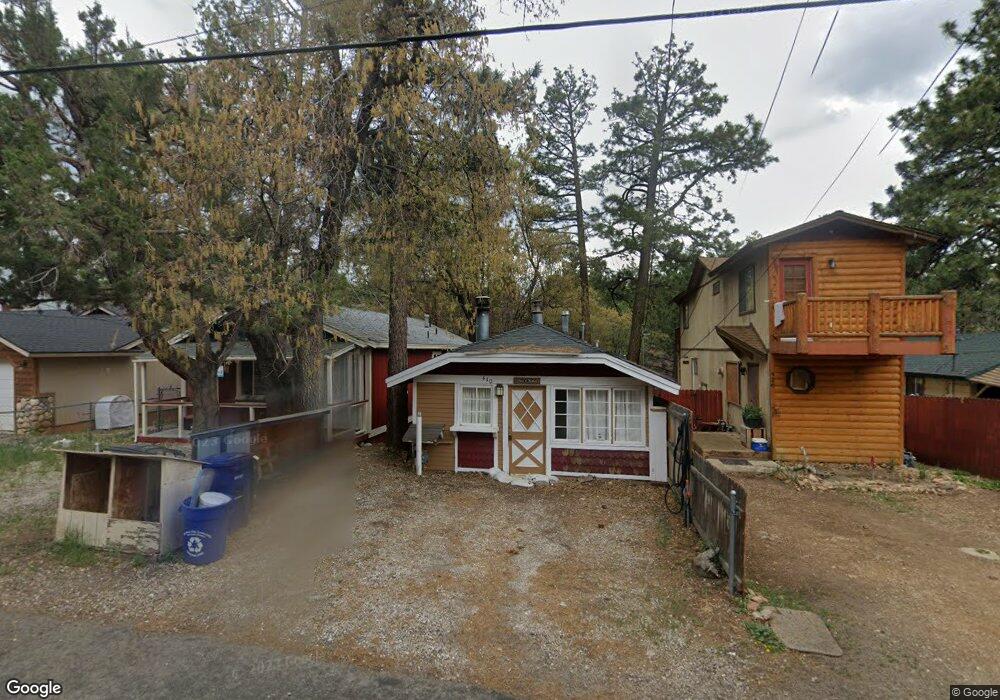
430 Sunset Ln Sugarloaf, CA 92386
Estimated Value: $241,015 - $281,000
2
Beds
1
Bath
774
Sq Ft
$343/Sq Ft
Est. Value
About This Home
This home is located at 430 Sunset Ln, Sugarloaf, CA 92386 and is currently estimated at $265,254, approximately $342 per square foot. 430 Sunset Ln is a home with nearby schools including Baldwin Lane Elementary School, Big Bear Middle School, and Big Bear High School.
Ownership History
Date
Name
Owned For
Owner Type
Purchase Details
Closed on
Apr 26, 2019
Sold by
The Raigosa Family Living Trust
Bought by
Raigosa Graciela Ann
Current Estimated Value
Purchase Details
Closed on
Sep 22, 2001
Sold by
Raigosa Henry and Raigosa Graciela Ana
Bought by
Raigosa Henry and Raigosa Graciela Ana
Purchase Details
Closed on
Sep 9, 1999
Sold by
Bailey Ann J
Bought by
Raigosa Henry and Raigosa Graciela Ana
Home Financials for this Owner
Home Financials are based on the most recent Mortgage that was taken out on this home.
Original Mortgage
$39,420
Outstanding Balance
$11,642
Interest Rate
7.77%
Estimated Equity
$253,612
Purchase Details
Closed on
Sep 25, 1998
Sold by
Bailey Ann J and Bailey Christopher J
Bought by
Bailey Ann J
Home Financials for this Owner
Home Financials are based on the most recent Mortgage that was taken out on this home.
Original Mortgage
$40,177
Interest Rate
6.88%
Mortgage Type
FHA
Purchase Details
Closed on
Jun 15, 1994
Sold by
Gunn Christopher James
Bought by
Bailey Ann J
Home Financials for this Owner
Home Financials are based on the most recent Mortgage that was taken out on this home.
Original Mortgage
$41,819
Interest Rate
8.73%
Mortgage Type
FHA
Create a Home Valuation Report for This Property
The Home Valuation Report is an in-depth analysis detailing your home's value as well as a comparison with similar homes in the area
Home Values in the Area
Average Home Value in this Area
Purchase History
| Date | Buyer | Sale Price | Title Company |
|---|---|---|---|
| Raigosa Graciela Ann | -- | None Available | |
| Raigosa Henry | -- | -- | |
| Raigosa Henry | $44,000 | Commonwealth Land Title Co | |
| Bailey Ann J | -- | Fidelity National Title Co | |
| Bailey Ann J | -- | Orange Coast Title Co |
Source: Public Records
Mortgage History
| Date | Status | Borrower | Loan Amount |
|---|---|---|---|
| Open | Raigosa Henry | $39,420 | |
| Previous Owner | Bailey Ann J | $40,177 | |
| Previous Owner | Bailey Ann J | $41,819 |
Source: Public Records
Tax History Compared to Growth
Tax History
| Year | Tax Paid | Tax Assessment Tax Assessment Total Assessment is a certain percentage of the fair market value that is determined by local assessors to be the total taxable value of land and additions on the property. | Land | Improvement |
|---|---|---|---|---|
| 2025 | $1,970 | $67,321 | $16,829 | $50,492 |
| 2024 | $1,970 | $66,001 | $16,499 | $49,502 |
| 2023 | $1,882 | $64,706 | $16,175 | $48,531 |
| 2022 | $1,786 | $63,437 | $15,858 | $47,579 |
| 2021 | $1,737 | $62,193 | $15,547 | $46,646 |
| 2020 | $1,711 | $61,556 | $15,388 | $46,168 |
| 2019 | $1,673 | $60,349 | $15,086 | $45,263 |
| 2018 | $1,605 | $59,165 | $14,790 | $44,375 |
| 2017 | $1,554 | $58,005 | $14,500 | $43,505 |
| 2016 | $1,512 | $56,868 | $14,216 | $42,652 |
| 2015 | $1,478 | $56,013 | $14,002 | $42,011 |
| 2014 | $1,449 | $54,916 | $13,728 | $41,188 |
Source: Public Records
Map
Nearby Homes
- 441 Sunset Ln
- 329 Vista Ln
- 313 Leonard Ln
- 410 Los Angeles Ave
- 491 Imperial Ave
- 374 Los Angeles Ave
- 358 Los Angeles Ave
- 477 Los Angeles Ave
- 0 Imperial Ave Unit TR25004497
- 0 Imperial Ave Unit 32502110
- 0 Imperial Ave Unit PW25185293
- 443 Holmes Ln
- 476 Los Angeles Ave
- 343 Holmes Ln
- 284 Leonard Ln
- 402 Highland Ln
- 523 Wabash Ln
- 412 San Bernardino Ave
- 479 Holmes Ln