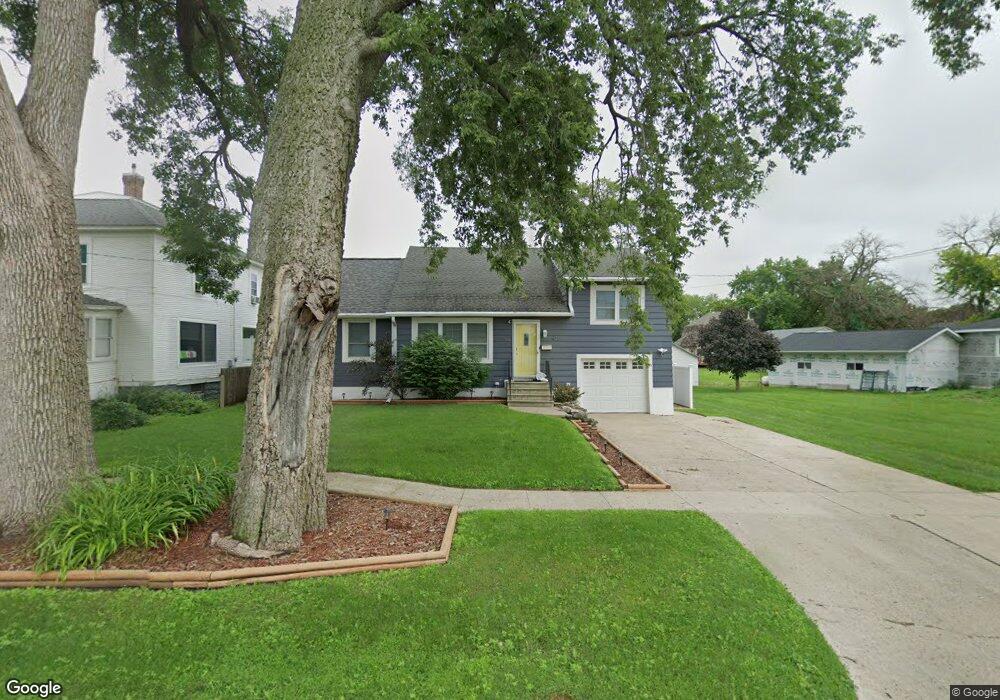
430 W 8th St Garner, IA 50438
Estimated Value: $222,000 - $291,000
3
Beds
2
Baths
1,561
Sq Ft
$164/Sq Ft
Est. Value
About This Home
This home is located at 430 W 8th St, Garner, IA 50438 and is currently estimated at $255,921, approximately $163 per square foot. 430 W 8th St is a home located in Hancock County with nearby schools including Garner-Hayfield-Ventura Elementary School and Garner-Hayfield-Ventura High School.
Ownership History
Date
Name
Owned For
Owner Type
Purchase Details
Closed on
Nov 23, 2021
Sold by
Johnson Laurie A
Bought by
Elbert Erika
Current Estimated Value
Home Financials for this Owner
Home Financials are based on the most recent Mortgage that was taken out on this home.
Original Mortgage
$192,060
Outstanding Balance
$176,136
Interest Rate
3.05%
Mortgage Type
New Conventional
Estimated Equity
$79,785
Purchase Details
Closed on
Jun 4, 2015
Sold by
Gouge Jeremiah J D and Gouge Gail R
Bought by
Johnson Laurie A
Create a Home Valuation Report for This Property
The Home Valuation Report is an in-depth analysis detailing your home's value as well as a comparison with similar homes in the area
Home Values in the Area
Average Home Value in this Area
Purchase History
| Date | Buyer | Sale Price | Title Company |
|---|---|---|---|
| Elbert Erika | $198,000 | None Listed On Document | |
| Johnson Laurie A | $80,000 | None Available |
Source: Public Records
Mortgage History
| Date | Status | Borrower | Loan Amount |
|---|---|---|---|
| Open | Elbert Erika | $192,060 |
Source: Public Records
Tax History Compared to Growth
Tax History
| Year | Tax Paid | Tax Assessment Tax Assessment Total Assessment is a certain percentage of the fair market value that is determined by local assessors to be the total taxable value of land and additions on the property. | Land | Improvement |
|---|---|---|---|---|
| 2025 | $3,250 | $249,080 | $21,420 | $227,660 |
| 2024 | $3,250 | $230,020 | $15,300 | $214,720 |
| 2023 | $3,388 | $230,020 | $15,300 | $214,720 |
| 2022 | $3,025 | $211,580 | $15,300 | $196,280 |
| 2021 | $2,694 | $184,920 | $15,300 | $169,620 |
| 2020 | $2,694 | $155,940 | $15,300 | $140,640 |
| 2019 | $2,084 | $155,940 | $15,300 | $140,640 |
| 2018 | $1,906 | $121,390 | $12,850 | $108,540 |
| 2017 | $1,254 | $80,980 | $0 | $0 |
| 2016 | $1,204 | $80,980 | $0 | $0 |
| 2015 | $1,204 | $79,270 | $0 | $0 |
| 2014 | $1,154 | $79,270 | $0 | $0 |
Source: Public Records
Map
Nearby Homes
- 320 W 8th St
- 495 W 5th St
- 390 W 5th St
- 490 Allen Ave
- 110 W 7th St
- 1065 Center Ave
- 1044 Bush Ave
- 1050 Bush Ave
- 490 W 11th St
- 340 Bush Ave
- 760 W 7th St
- 645 Maben Ave
- 750 Pebblestone Ln
- 1145 State St
- 780 W 5th St
- 965 Cobblestone Ln
- 970 Cobblestone Ln
- 1330 Bush Ave
- 640 W Lyons St
- 1440 State St Unit 1450