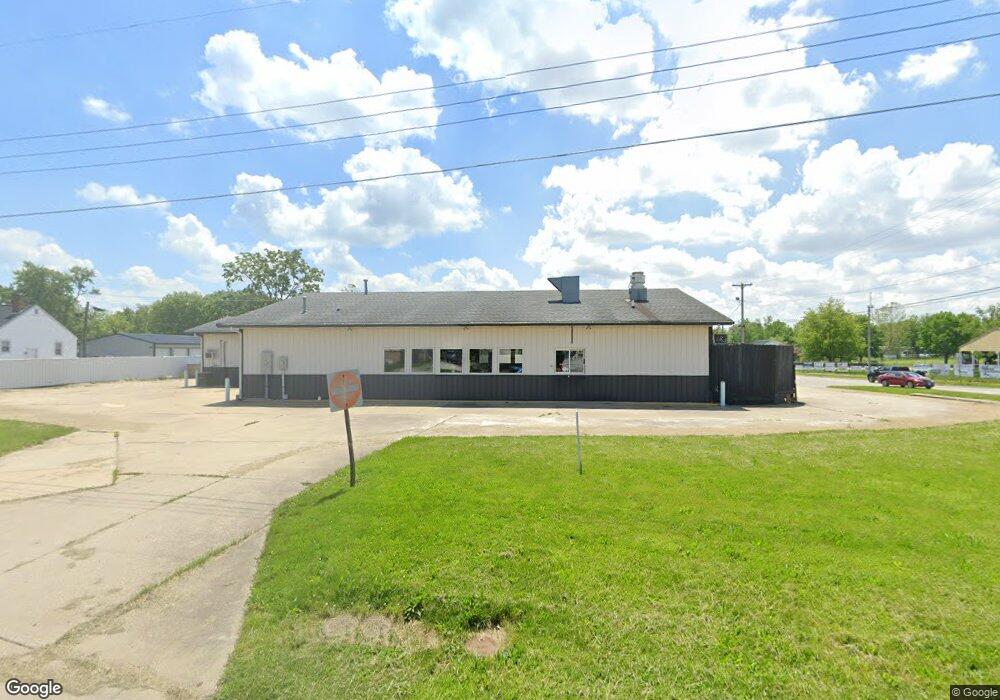
430 W State St Charleston, IL 61920
Estimated Value: $375,340
--
Bed
2
Baths
3,600
Sq Ft
$104/Sq Ft
Est. Value
About This Home
This home is located at 430 W State St, Charleston, IL 61920 and is currently estimated at $375,340, approximately $104 per square foot. 430 W State St is a home located in Coles County with nearby schools including Charleston High School and Charleston Christian Academy.
Ownership History
Date
Name
Owned For
Owner Type
Purchase Details
Closed on
May 12, 2025
Sold by
Rebollo Properties Llc
Bought by
Rebollo Miguel A and Rebollo Mikki R
Current Estimated Value
Purchase Details
Closed on
Aug 16, 2024
Sold by
Rebollo Miguel A and Rebollo Mikiu R
Bought by
Rebollo Properties Llc
Purchase Details
Closed on
Mar 31, 2022
Sold by
Bickers Donna L and Sebright Daniel C
Bought by
Rebollo Miguel A and Solis Oscar V
Home Financials for this Owner
Home Financials are based on the most recent Mortgage that was taken out on this home.
Original Mortgage
$270,000
Interest Rate
3.92%
Mortgage Type
New Conventional
Create a Home Valuation Report for This Property
The Home Valuation Report is an in-depth analysis detailing your home's value as well as a comparison with similar homes in the area
Home Values in the Area
Average Home Value in this Area
Purchase History
| Date | Buyer | Sale Price | Title Company |
|---|---|---|---|
| Rebollo Miguel A | -- | None Listed On Document | |
| Rebollo Properties Llc | -- | None Listed On Document | |
| Rebollo Miguel A | -- | None Listed On Document |
Source: Public Records
Mortgage History
| Date | Status | Borrower | Loan Amount |
|---|---|---|---|
| Previous Owner | Rebollo Miguel A | $270,000 |
Source: Public Records
Tax History Compared to Growth
Tax History
| Year | Tax Paid | Tax Assessment Tax Assessment Total Assessment is a certain percentage of the fair market value that is determined by local assessors to be the total taxable value of land and additions on the property. | Land | Improvement |
|---|---|---|---|---|
| 2024 | $8,983 | $115,756 | $50,782 | $64,974 |
| 2023 | $8,847 | $105,713 | $46,376 | $59,337 |
| 2022 | $8,864 | $103,967 | $45,610 | $58,357 |
| 2021 | $7,576 | $82,790 | $43,772 | $39,018 |
| 2020 | $7,710 | $85,779 | $45,352 | $40,427 |
| 2019 | $7,584 | $82,790 | $43,772 | $39,018 |
| 2018 | $6,525 | $72,000 | $43,772 | $28,228 |
| 2017 | $6,440 | $106,530 | $43,772 | $62,758 |
| 2016 | $5,751 | $64,850 | $13,790 | $51,060 |
| 2015 | $5,937 | $64,850 | $13,790 | $51,060 |
| 2014 | $5,937 | $64,850 | $13,790 | $51,060 |
| 2013 | $5,937 | $64,850 | $13,790 | $51,060 |
Source: Public Records
Map
Nearby Homes