C
Seller's Agent in 2012
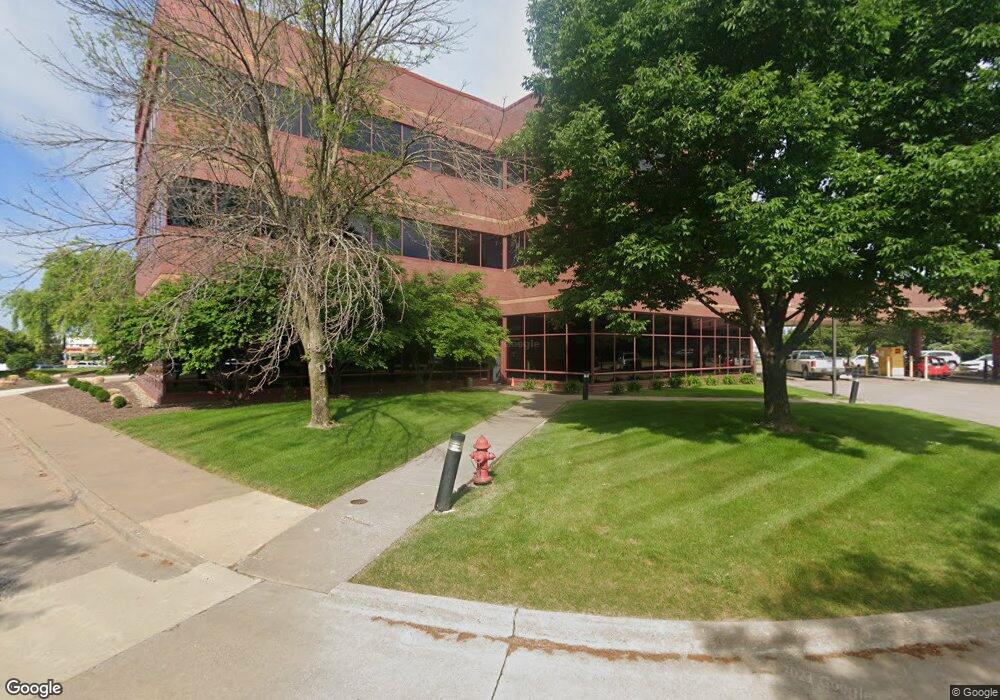
Charles Ruhl
NAI Ruhl Commercial Company
Comp purposes only.
Last Agent to Sell the Property
Charles Ruhl
NAI Ruhl Commercial Company Listed on: 08/16/2012
| Date | Buyer | Sale Price | Title Company |
|---|---|---|---|
| Consolidated Wf Llc | -- | None Available | |
| Mogul Holdings Llc | $5,100,000 | None Available |
| Date | Status | Borrower | Loan Amount |
|---|---|---|---|
| Open | Consolidated Wf Llc | $4,080,000 |
| Date | Event | Price | List to Sale | Price per Sq Ft |
|---|---|---|---|---|
| 08/21/2012 08/21/12 | Sold | $5,100,000 | 0.0% | $170 / Sq Ft |
| 08/16/2012 08/16/12 | For Sale | $5,100,000 | -- | $170 / Sq Ft |
| 05/29/2012 05/29/12 | Pending | -- | -- | -- |
| Year | Tax Paid | Tax Assessment Tax Assessment Total Assessment is a certain percentage of the fair market value that is determined by local assessors to be the total taxable value of land and additions on the property. | Land | Improvement |
|---|---|---|---|---|
| 2024 | $160,468 | $4,922,620 | $1,761,980 | $3,160,640 |
| 2023 | $163,100 | $4,922,620 | $1,761,980 | $3,160,640 |
| 2022 | $162,054 | $5,025,700 | $1,761,980 | $3,263,720 |
| 2021 | $162,054 | $5,025,700 | $1,761,980 | $3,263,720 |
| 2020 | $168,640 | $5,025,700 | $1,761,980 | $3,263,720 |
| 2019 | $166,832 | $4,930,620 | $1,761,980 | $3,168,640 |
| 2018 | $170,552 | $4,930,620 | $1,761,980 | $3,168,640 |
| 2017 | $160,825 | $4,930,620 | $1,761,980 | $3,168,640 |
| 2016 | $157,185 | $0 | $0 | $0 |
| 2015 | $151,354 | $0 | $0 | $0 |
| 2014 | $153,670 | $0 | $0 | $0 |
| 2013 | $164,312 | $0 | $0 | $0 |
| 2012 | -- | $4,541,300 | $1,604,100 | $2,937,200 |
C
Seller's Agent in 2012
Charles Ruhl
NAI Ruhl Commercial Company

Buyer's Agent in 2012
Thad DenHartog
Mel Foster Co. Commercial
(563) 650-8676
7 in this area
122 Total Sales
Source: RMLS Alliance
MLS Number: RMAQC7027931
APN: Y0917-14
Disclaimer: Certain information contained herein is derived from information provided by parties other than Homes.com. All information provided is deemed reliable, but is not guaranteed to be accurate and should be independently verified.
![]() IDX information is provided exclusively for personal, non-commercial use, and may not be used for any purpose other than to identify prospective properties consumers may be interested in purchasing. Information is deemed reliable but not guaranteed.
IDX information is provided exclusively for personal, non-commercial use, and may not be used for any purpose other than to identify prospective properties consumers may be interested in purchasing. Information is deemed reliable but not guaranteed.