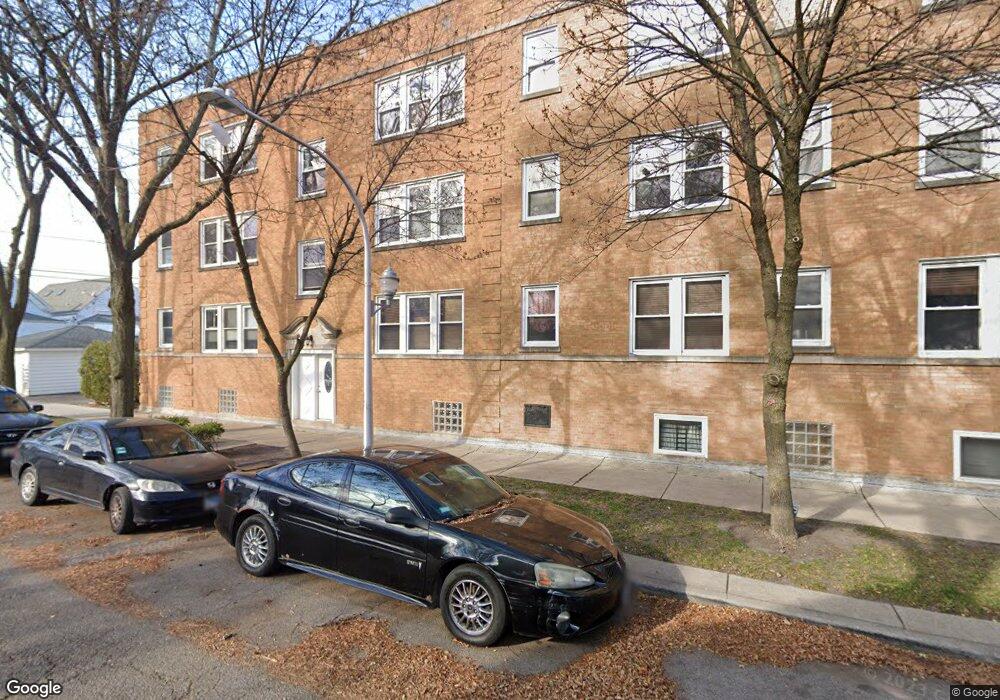
4300 N Whipple St Unit 43001 Chicago, IL 60618
Irving Park NeighborhoodEstimated Value: $229,716 - $264,000
2
Beds
1
Bath
9,320
Sq Ft
$27/Sq Ft
Est. Value
About This Home
This home is located at 4300 N Whipple St Unit 43001, Chicago, IL 60618 and is currently estimated at $249,929, approximately $26 per square foot. 4300 N Whipple St Unit 43001 is a home located in Cook County with nearby schools including Bateman Elementary School, Roosevelt High School, and Queen Of Angels Elementary School.
Ownership History
Date
Name
Owned For
Owner Type
Purchase Details
Closed on
Oct 23, 2019
Sold by
Wahlmann Isabelle Antoinette
Bought by
Taylor Elizabeth Pennington
Current Estimated Value
Home Financials for this Owner
Home Financials are based on the most recent Mortgage that was taken out on this home.
Original Mortgage
$152,500
Outstanding Balance
$134,273
Interest Rate
3.75%
Mortgage Type
New Conventional
Estimated Equity
$115,656
Purchase Details
Closed on
Oct 22, 2015
Sold by
Wahlmann Isabelle Antoinette
Bought by
Wahlmann Isabelle Antoinette and Isabelle Antoinette Wahlmann Revocable T
Purchase Details
Closed on
Aug 19, 2015
Sold by
4300 N Whipple Ii Llc
Bought by
Wahlmann Isabelle A
Purchase Details
Closed on
Apr 20, 2012
Sold by
Montenegro Beatriz and Montenegro Hugo
Bought by
4300 North Whipple Ii Llc
Create a Home Valuation Report for This Property
The Home Valuation Report is an in-depth analysis detailing your home's value as well as a comparison with similar homes in the area
Home Values in the Area
Average Home Value in this Area
Purchase History
| Date | Buyer | Sale Price | Title Company |
|---|---|---|---|
| Taylor Elizabeth Pennington | $172,500 | Chicago Title | |
| Wahlmann Isabelle Antoinette | -- | Attorney | |
| Wahlmann Isabelle A | $130,000 | Mgr | |
| 4300 North Whipple Ii Llc | $61,000 | None Available |
Source: Public Records
Mortgage History
| Date | Status | Borrower | Loan Amount |
|---|---|---|---|
| Open | Taylor Elizabeth Pennington | $152,500 |
Source: Public Records
Tax History Compared to Growth
Tax History
| Year | Tax Paid | Tax Assessment Tax Assessment Total Assessment is a certain percentage of the fair market value that is determined by local assessors to be the total taxable value of land and additions on the property. | Land | Improvement |
|---|---|---|---|---|
| 2024 | $2,752 | $18,483 | $2,480 | $16,003 |
| 2023 | $2,683 | $13,000 | $2,000 | $11,000 |
| 2022 | $2,683 | $13,000 | $2,000 | $11,000 |
| 2021 | $2,623 | $12,999 | $1,999 | $11,000 |
| 2020 | $2,290 | $10,244 | $879 | $9,365 |
| 2019 | $2,300 | $11,409 | $879 | $10,530 |
| 2018 | $1,580 | $11,409 | $879 | $10,530 |
| 2017 | $2,453 | $14,734 | $799 | $13,935 |
| 2016 | $2,459 | $14,734 | $799 | $13,935 |
| 2015 | $2,709 | $14,734 | $799 | $13,935 |
| 2014 | $3,037 | $16,307 | $719 | $15,588 |
| 2013 | $2,977 | $16,307 | $719 | $15,588 |
Source: Public Records
Map
Nearby Homes
- 4307 N Troy St Unit 1
- 4333 N Troy St Unit 3E
- 4343 N Sacramento Ave Unit A-G
- 3102 W Berteau Ave Unit 31023
- 4347 N Richmond St Unit 1N
- 4347 N Richmond St Unit 1S
- 4347 N Richmond St Unit 3N
- 4347 N Richmond St Unit 2N
- 4231 N Kedzie Ave Unit 3E
- 4411 N Sacramento Ave Unit 1
- 4229 N Kedzie Ave
- 4410 N Troy St Unit 101
- 4437 N Whipple St
- 4425 N Sacramento Ave
- 4141 N Kedzie Ave Unit 307
- 3055 W Sunnyside Ave Unit 1
- 3222 W Berteau Ave Unit 2
- 4248 N Sawyer Ave
- 4438 N Kedzie Ave Unit G-1
- 4116 N Kedzie Ave
- 4300 N Whipple St Unit 43003
- 4300 N Whipple St Unit 43002
- 4300 N Whipple St Unit 4300G
- 4300 N Whipple St Unit GDN
- 4300 N Whipple St Unit 3
- 4300 N Whipple St Unit 2
- 4300 N Whipple St Unit 1
- 4300 N Whipple St Unit G
- 4300 N Whipple St Unit 213
- 3036 W Cullom Ave Unit 30363
- 3036 W Cullom Ave Unit 30362
- 3036 W Cullom Ave Unit 30361
- 3036 W Cullom Ave Unit 3E
- 3036 W Cullom Ave Unit 3
- 3036 W Cullom Ave Unit 2
- 3036 W Cullom Ave Unit 1
- 4302 N Whipple St
- 3038 W Cullom Ave Unit P2
- 3038 W Cullom Ave Unit P1
- 3038 W Cullom Ave Unit 30383