Estimated Value: $739,000 - $1,288,000
5
Beds
4
Baths
7,540
Sq Ft
$135/Sq Ft
Est. Value
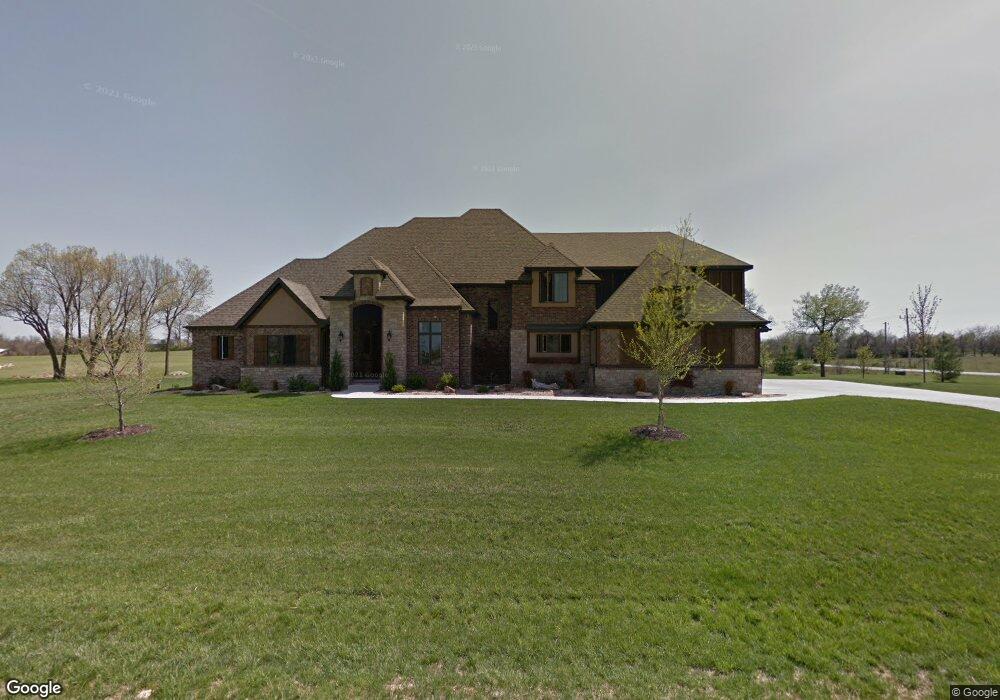
About This Home
This home is located at 4300 Rumson Rd, Nixa, MO 65714 and is currently estimated at $1,021,637, approximately $135 per square foot. 4300 Rumson Rd is a home located in Christian County with nearby schools including High Pointe Elementary School, Summit Intermediate School, and Nixa Junior High School.
Ownership History
Date
Name
Owned For
Owner Type
Purchase Details
Closed on
Feb 28, 2020
Sold by
Nichols Scott A and Nichols Jenna L
Bought by
Phil Isley and Phil Jessica Birchem
Current Estimated Value
Purchase Details
Closed on
Dec 19, 2019
Sold by
Springfield Property Solutions
Bought by
Scott Nichols Enterprises Llc
Purchase Details
Closed on
Sep 6, 2018
Sold by
Town And Country Village Apartments Llc
Bought by
Scott Nicholes Enterprises Llc
Purchase Details
Closed on
Jan 10, 2018
Sold by
Creative Investments Llc
Bought by
Scott Nicholas Enterprises Llc
Purchase Details
Closed on
Dec 12, 2012
Sold by
Sundy Paul S and Sundy Crystal S
Bought by
Nichols Scott A and Nichols Jenna L
Purchase Details
Closed on
Sep 12, 2010
Sold by
Ozark Bank
Bought by
Nichols Scott A and Nichols Jenna L
Create a Home Valuation Report for This Property
The Home Valuation Report is an in-depth analysis detailing your home's value as well as a comparison with similar homes in the area
Home Values in the Area
Average Home Value in this Area
Purchase History
| Date | Buyer | Sale Price | Title Company |
|---|---|---|---|
| Phil Isley | -- | Hogan Land Title Company | |
| Scott Nichols Enterprises Llc | -- | Titan Ttl & Closing Of Mo Ll | |
| Scott Nicholes Enterprises Llc | -- | Hogan Land Title Company | |
| Scott Nicholas Enterprises Llc | -- | Titan Ttl & Closing Of Mo Ll | |
| Nichols Scott A | -- | None Available | |
| Nichols Scott A | -- | Great American Title |
Source: Public Records
Tax History
| Year | Tax Paid | Tax Assessment Tax Assessment Total Assessment is a certain percentage of the fair market value that is determined by local assessors to be the total taxable value of land and additions on the property. | Land | Improvement |
|---|---|---|---|---|
| 2025 | $10,986 | $185,080 | -- | -- |
| 2024 | $10,804 | $172,820 | -- | -- |
| 2023 | $10,804 | $170,160 | $0 | $0 |
| 2022 | $8,739 | $137,430 | $0 | $0 |
| 2021 | $8,456 | $137,430 | $0 | $0 |
| 2020 | $7,868 | $125,500 | $0 | $0 |
| 2019 | $7,868 | $125,500 | $0 | $0 |
| 2018 | $7,300 | $125,500 | $0 | $0 |
| 2017 | $7,300 | $125,500 | $0 | $0 |
| 2016 | $7,183 | $125,570 | $0 | $0 |
| 2015 | $7,193 | $125,570 | $125,570 | $0 |
| 2014 | $7,113 | $125,590 | $0 | $0 |
| 2013 | $7 | $125,590 | $0 | $0 |
| 2011 | $7 | $251,180 | $0 | $0 |
Source: Public Records
Map
Nearby Homes
- 8326 Shinnecock Dr
- 714 N Fox Hill Cir
- 711 N Greer Ave
- 4807 Rolling Hills Dr
- 935 E Thorndale Dr
- 856 E Edenmore Cir
- 921 E Thorndale Dr
- 861 Bantry Ct
- 867 E Edenmore Cir
- 679 N Fox Hill Cir
- 1419 Rich Hill Cir
- 920 E Weldon Dr
- 3318 Winged Foot Dr
- 1411 E Hayston Ave
- 842 E Abbey Ct
- 711 N Baywood Dr
- 1373 N Rockingham Ave
- 707 N Baywood Dr
- 1410 E Hayston Ave
- 8643 Interlochen Dr
- 4311 Rumson Rd
- 4238 Rumson Rd
- 0 Fair Haven Ph 4 Unit 11106439
- 0 Fair Haven Ph 4 Unit 11016198
- 0 Rumson Unit 10811014
- 0 Rumson Unit 10811018
- 0 Rumson Unit 10902986
- 0 Rumson Unit 10903000
- 0 Rumson Unit 10903002
- 0 Rumson Unit 10903433
- 0 Rumson Unit 60113049
- Lot 8 Rumson
- Lot 4 Rumson
- 4227 Rumson Rd
- 4308 Buttonwood Dr
- 1417 Cheyenne Rd
- 4306 Buttonwood Dr
- 4208 Rumson
- 1070 Arrowhead Dr
- 4302 Buttonwood Dr
Your Personal Tour Guide
Ask me questions while you tour the home.