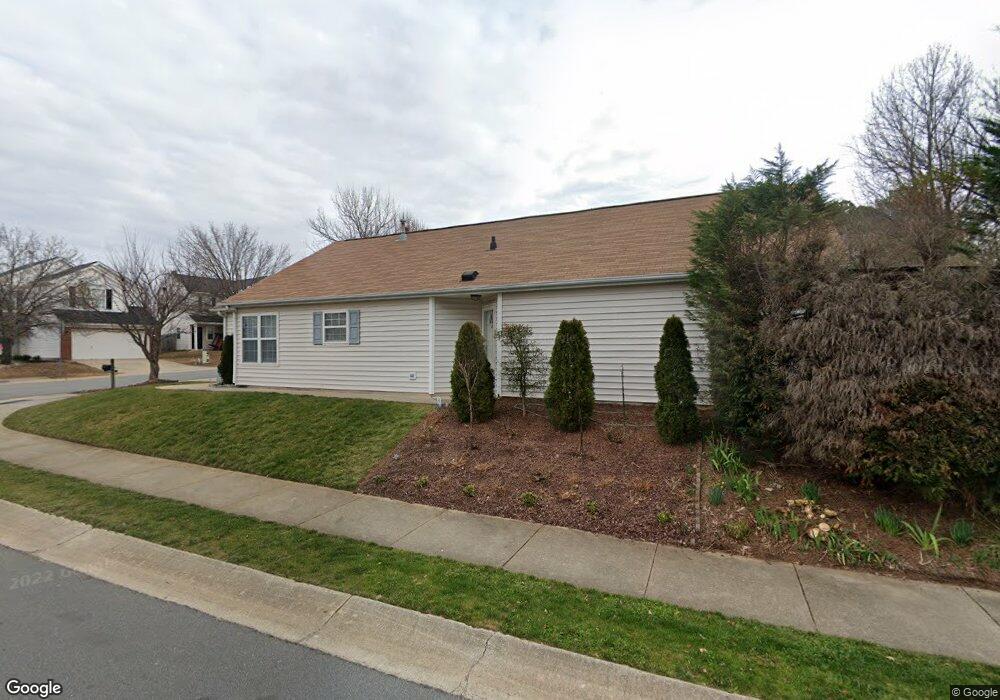
4300 Standing Rock Way Raleigh, NC 27604
Northeast Raleigh NeighborhoodEstimated Value: $307,000 - $320,000
3
Beds
2
Baths
1,298
Sq Ft
$241/Sq Ft
Est. Value
About This Home
This home is located at 4300 Standing Rock Way, Raleigh, NC 27604 and is currently estimated at $313,393, approximately $241 per square foot. 4300 Standing Rock Way is a home located in Wake County with nearby schools including Wilburn Elementary, Durant Road Middle, and Millbrook High School.
Ownership History
Date
Name
Owned For
Owner Type
Purchase Details
Closed on
Jan 28, 2011
Sold by
Kidney William Frank
Bought by
Hernandez Luis Alonzo and Martinez Elena Guadelupe Cerna
Current Estimated Value
Home Financials for this Owner
Home Financials are based on the most recent Mortgage that was taken out on this home.
Original Mortgage
$116,958
Outstanding Balance
$80,373
Interest Rate
4.87%
Mortgage Type
FHA
Estimated Equity
$233,020
Purchase Details
Closed on
Feb 8, 2007
Sold by
Woodruff Lori Alexander and Woodruff Troy L
Bought by
Kidney William Frank
Home Financials for this Owner
Home Financials are based on the most recent Mortgage that was taken out on this home.
Original Mortgage
$25,980
Interest Rate
6.14%
Mortgage Type
Unknown
Purchase Details
Closed on
Jun 17, 1999
Sold by
M/I Schottenstein Homes Inc
Bought by
Alexander Lori A
Home Financials for this Owner
Home Financials are based on the most recent Mortgage that was taken out on this home.
Original Mortgage
$98,982
Interest Rate
7.04%
Mortgage Type
FHA
Create a Home Valuation Report for This Property
The Home Valuation Report is an in-depth analysis detailing your home's value as well as a comparison with similar homes in the area
Home Values in the Area
Average Home Value in this Area
Purchase History
| Date | Buyer | Sale Price | Title Company |
|---|---|---|---|
| Hernandez Luis Alonzo | $120,000 | None Available | |
| Kidney William Frank | $130,000 | None Available | |
| Alexander Lori A | $100,500 | -- |
Source: Public Records
Mortgage History
| Date | Status | Borrower | Loan Amount |
|---|---|---|---|
| Open | Hernandez Luis Alonzo | $116,958 | |
| Previous Owner | Kidney William Frank | $25,980 | |
| Previous Owner | Kidney William Frank | $103,920 | |
| Previous Owner | Alexander Lori A | $98,982 |
Source: Public Records
Tax History Compared to Growth
Tax History
| Year | Tax Paid | Tax Assessment Tax Assessment Total Assessment is a certain percentage of the fair market value that is determined by local assessors to be the total taxable value of land and additions on the property. | Land | Improvement |
|---|---|---|---|---|
| 2025 | $2,734 | $311,235 | $90,000 | $221,235 |
| 2024 | $2,723 | $281,067 | $90,000 | $191,067 |
| 2023 | $1,993 | $180,977 | $42,000 | $138,977 |
| 2022 | $1,852 | $180,977 | $42,000 | $138,977 |
| 2021 | $1,781 | $180,977 | $42,000 | $138,977 |
| 2020 | $1,749 | $180,977 | $42,000 | $138,977 |
| 2019 | $1,512 | $128,757 | $24,000 | $104,757 |
| 2018 | $1,427 | $128,757 | $24,000 | $104,757 |
| 2017 | $1,359 | $128,757 | $24,000 | $104,757 |
| 2016 | $1,332 | $128,757 | $24,000 | $104,757 |
| 2015 | $1,398 | $133,069 | $23,000 | $110,069 |
| 2014 | $1,326 | $133,069 | $23,000 | $110,069 |
Source: Public Records
Map
Nearby Homes
- 4217 Toccopola St
- 4213 Tensity Dr
- 4221 Tensity Dr
- 4236 Tensity Dr
- 4232 Palafox Ct
- 2400 Dorety Place
- 4305 Beacon Crest Way
- 2109 Woodwyck Way
- 2415 Dorety Place
- 2509 Westham Place
- 4212 Beacon Crest Way
- Wyatt Plan at Elm Grove - Club Collection
- 4608 Mowbray Dr
- 4400 Knightsbridge Way
- 2307 Oakwood Meadows Ct
- 4309 Birmingham Way
- 2305 Oakwood Meadows Ct
- 2303 Oakwood Meadows Ct
- 2848 Roundleaf Ct
- 2716 Dove Ln
- 4299 Mantua Way
- 4304 Standing Rock Way
- 4308 Standing Rock Way
- 4301 Mantua Way
- 4220 Standing Rock Way
- 4224 Standing Rock Way
- 4222 Standing Rock Way
- 4226 Standing Rock Way
- 4305 Mantua Way
- 4312 Standing Rock Way
- 4301 Standing Rock Way
- 4305 Standing Rock Way
- 4219 Mantua Way
- 4206 Standing Rock Way
- 4309 Standing Rock Way
- 4316 Standing Rock Way
- 4309 Mantua Way
- 4227 Standing Rock Way
- 4204 Standing Rock Way
- 4313 Standing Rock Way