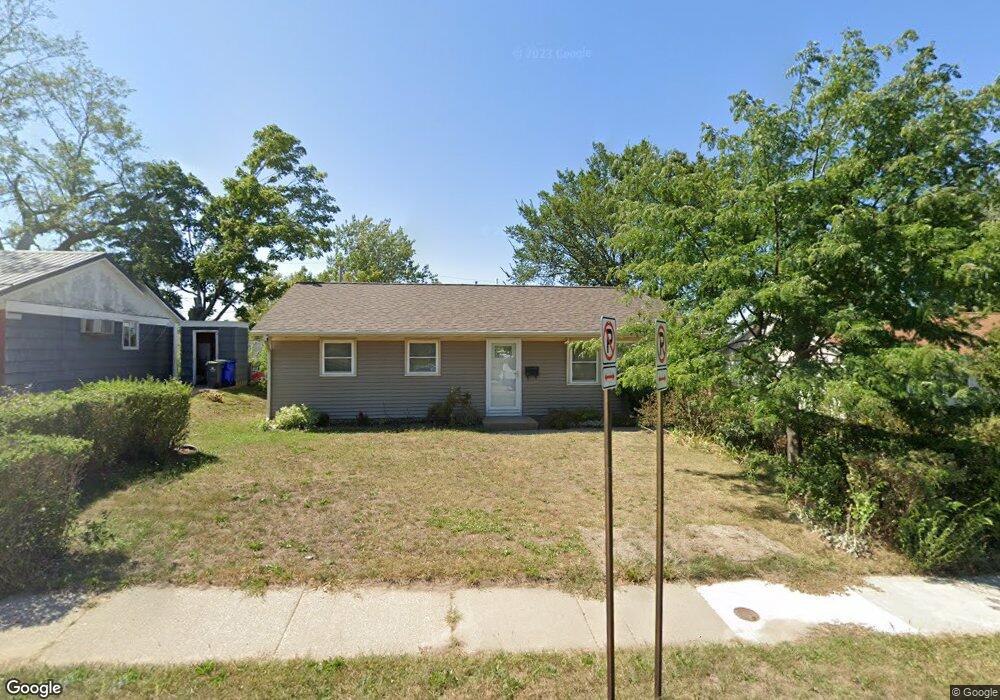
4301 Council St NE Cedar Rapids, IA 52402
Noelridge Park NeighborhoodEstimated Value: $159,940 - $173,000
4
Beds
1
Bath
1,200
Sq Ft
$137/Sq Ft
Est. Value
About This Home
This home is located at 4301 Council St NE, Cedar Rapids, IA 52402 and is currently estimated at $163,985, approximately $136 per square foot. 4301 Council St NE is a home located in Linn County with nearby schools including Wright Elementary School, Harding Middle School, and George Washington High School.
Ownership History
Date
Name
Owned For
Owner Type
Purchase Details
Closed on
Sep 25, 2013
Sold by
Scott Ryan A and Scott Ryan
Bought by
Smith Iona W
Current Estimated Value
Home Financials for this Owner
Home Financials are based on the most recent Mortgage that was taken out on this home.
Original Mortgage
$12,500
Outstanding Balance
$3,308
Interest Rate
4.56%
Mortgage Type
Stand Alone Second
Estimated Equity
$160,677
Purchase Details
Closed on
Nov 15, 2005
Sold by
Barth Diane Marie and Barth Dean
Bought by
Scott Ryan A and Scott Brandi S
Home Financials for this Owner
Home Financials are based on the most recent Mortgage that was taken out on this home.
Original Mortgage
$93,500
Interest Rate
6.48%
Mortgage Type
Fannie Mae Freddie Mac
Purchase Details
Closed on
Jul 13, 1998
Sold by
Mcmaster Robert K and Mcmaster Frances Louise
Bought by
Wickman Diane M
Home Financials for this Owner
Home Financials are based on the most recent Mortgage that was taken out on this home.
Original Mortgage
$69,964
Interest Rate
7.15%
Mortgage Type
FHA
Create a Home Valuation Report for This Property
The Home Valuation Report is an in-depth analysis detailing your home's value as well as a comparison with similar homes in the area
Home Values in the Area
Average Home Value in this Area
Purchase History
| Date | Buyer | Sale Price | Title Company |
|---|---|---|---|
| Smith Iona W | $105,000 | None Available | |
| Scott Ryan A | $93,000 | None Available | |
| Wickman Diane M | $69,500 | -- |
Source: Public Records
Mortgage History
| Date | Status | Borrower | Loan Amount |
|---|---|---|---|
| Open | Smith Iona W | $12,500 | |
| Previous Owner | Scott Ryan A | $93,500 | |
| Previous Owner | Wickman Diane M | $69,964 |
Source: Public Records
Tax History Compared to Growth
Tax History
| Year | Tax Paid | Tax Assessment Tax Assessment Total Assessment is a certain percentage of the fair market value that is determined by local assessors to be the total taxable value of land and additions on the property. | Land | Improvement |
|---|---|---|---|---|
| 2025 | $2,176 | $148,100 | $28,200 | $119,900 |
| 2024 | $2,310 | $135,600 | $28,200 | $107,400 |
| 2023 | $2,310 | $133,400 | $25,400 | $108,000 |
| 2022 | $2,128 | $118,400 | $22,600 | $95,800 |
| 2021 | $2,220 | $111,700 | $19,700 | $92,000 |
| 2020 | $2,220 | $109,200 | $19,700 | $89,500 |
| 2019 | $2,134 | $99,000 | $19,700 | $79,300 |
| 2018 | $2,074 | $99,000 | $19,700 | $79,300 |
| 2017 | $2,174 | $99,800 | $19,700 | $80,100 |
| 2016 | $2,106 | $99,100 | $19,700 | $79,400 |
| 2015 | $2,098 | $98,642 | $18,330 | $80,312 |
| 2014 | $2,098 | $98,642 | $18,330 | $80,312 |
| 2013 | $1,868 | $98,642 | $18,330 | $80,312 |
Source: Public Records
Map
Nearby Homes
- 4309 Benton St NE
- 1456 Miami Dr NE
- 1006 Messina Dr NE
- 1138 Messina Dr NE
- 1129 Clifton St NE
- 1611 Hollywood Blvd NE
- 1638 47th St NE
- 1231 Miami Ct NE
- 3711 Oakland Rd NE
- 3704 Richmond Rd NE
- 1101 Dover St NE
- 1222 35th St NE
- 2044 Evergreen St NE
- 2106 42nd St NE
- 1721 34th St NE
- 1114 35th St NE
- 1051 35th St NE
- 4523 Regal Ave NE
- 1134 Center St NE
- 1032 34th St NE
- 4233 Council St NE
- 4309 Council St NE
- 4300 Benton St NE
- 4232 Benton St NE
- 4308 Benton St NE
- 4225 Council St NE
- 4317 Council St NE
- 4224 Benton St NE
- 4316 Benton St NE
- 4322 Benton St NE
- 4217 Council St NE
- 4325 Council St NE
- 4216 Benton St NE
- 4324 Benton St NE
- 4209 Council St NE
- 4333 Council St NE
- 4208 Benton St NE
- 4332 Benton St NE
- 4301 Benton St NE
- 4233 Benton St NE