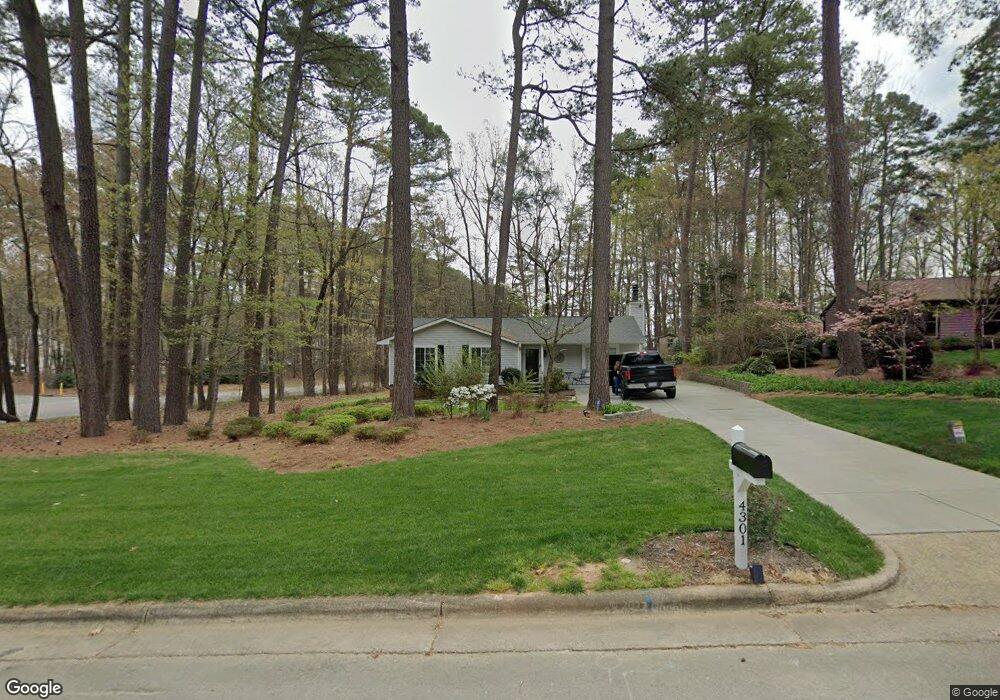
4301 Craddock Rd Raleigh, NC 27613
Northwest Raleigh NeighborhoodEstimated Value: $362,000 - $419,000
3
Beds
2
Baths
1,312
Sq Ft
$304/Sq Ft
Est. Value
About This Home
This home is located at 4301 Craddock Rd, Raleigh, NC 27613 and is currently estimated at $399,086, approximately $304 per square foot. 4301 Craddock Rd is a home located in Wake County with nearby schools including York Elementary School, Leesville Road Middle School, and Leesville Road High School.
Ownership History
Date
Name
Owned For
Owner Type
Purchase Details
Closed on
Jul 17, 2014
Sold by
Mccallum Nicholas John
Bought by
Dubon Isai R and Balderas Avigail Nigoche
Current Estimated Value
Purchase Details
Closed on
Sep 14, 2007
Sold by
Mccallum John R and Mccallum Julia Ann
Bought by
Mccallum Nicholas John
Purchase Details
Closed on
Jun 16, 2005
Sold by
Farmer Bruce H
Bought by
Mccallum John R and Mccallum Nicholas
Home Financials for this Owner
Home Financials are based on the most recent Mortgage that was taken out on this home.
Original Mortgage
$128,981
Interest Rate
5.59%
Mortgage Type
FHA
Purchase Details
Closed on
May 23, 2005
Sold by
Farmer Bruce H and Farmer Marie
Bought by
Farmer Bruce H
Home Financials for this Owner
Home Financials are based on the most recent Mortgage that was taken out on this home.
Original Mortgage
$128,981
Interest Rate
5.59%
Mortgage Type
FHA
Create a Home Valuation Report for This Property
The Home Valuation Report is an in-depth analysis detailing your home's value as well as a comparison with similar homes in the area
Home Values in the Area
Average Home Value in this Area
Purchase History
| Date | Buyer | Sale Price | Title Company |
|---|---|---|---|
| Dubon Isai R | $180,000 | None Available | |
| Mccallum Nicholas John | -- | None Available | |
| Mccallum John R | $130,000 | -- | |
| Farmer Bruce H | -- | -- |
Source: Public Records
Mortgage History
| Date | Status | Borrower | Loan Amount |
|---|---|---|---|
| Previous Owner | Mccallum John R | $128,981 |
Source: Public Records
Tax History
| Year | Tax Paid | Tax Assessment Tax Assessment Total Assessment is a certain percentage of the fair market value that is determined by local assessors to be the total taxable value of land and additions on the property. | Land | Improvement |
|---|---|---|---|---|
| 2025 | $3,460 | $394,439 | $200,000 | $194,439 |
| 2024 | $3,446 | $394,439 | $200,000 | $194,439 |
Source: Public Records
Map
Nearby Homes
- 7015 Gentle Pine Place
- 4541 Hershey Ct
- 4536 Hamptonshire Dr
- 4534 Hamptonshire Dr Unit B22
- 4522 Hamptonshire Dr
- 4619 Hershey Ct
- 104 Oak Hollow Ct Unit 104
- 404 Broad Leaf Cir Unit 404
- 403 Broad Leaf Cir Unit 403
- 202 Oak Hollow Ct
- 4104 Betterton Dr
- 4103 Landfall Ct
- 7109 Benhart Dr
- 6422 Tanner Oak Ln
- 6420 Tanner Oak Ln
- 7104 Kinross Dr
- 6408 Tanner Oak Ln
- 7121 Kinross Dr
- 4307 Southwind Dr Unit H5
- 4329 Southwind Dr
- 4305 Craddock Rd
- 4309 Craddock Rd
- 4300 Craddock Rd
- 4304 Craddock Rd
- 000 Leesville Rd
- 4313 Craddock Rd
- 4308 Craddock Rd
- 4312 Craddock Rd
- 4317 Craddock Rd
- 7207 Newport Ave
- 7211 Newport Ave
- 4316 Craddock Rd
- 7203 Newport Ave
- 4321 Craddock Rd
- 7215 Newport Ave
- 7219 Newport Ave
- 4320 Craddock Rd
- 4325 Craddock Rd
- 7223 Newport Ave
- 7301 Leesville Rd
Your Personal Tour Guide
Ask me questions while you tour the home.