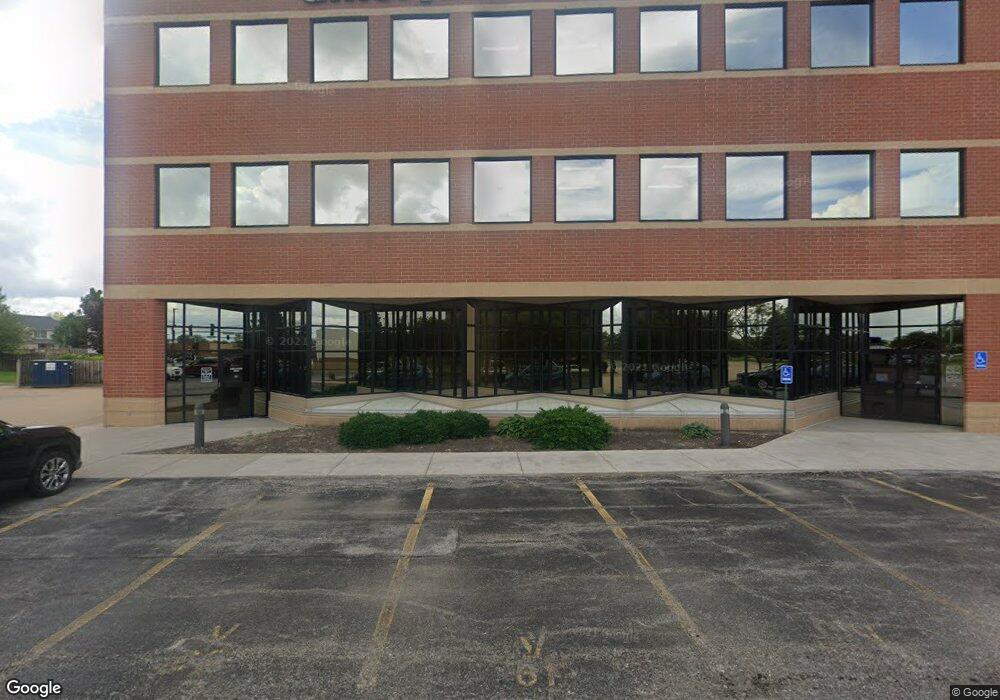
4301 E 53rd St Unit 301 Davenport, IA 52807
Estimated Value: $9,469,978
--
Bed
--
Bath
32,117
Sq Ft
$295/Sq Ft
Est. Value
About This Home
This home is located at 4301 E 53rd St Unit 301, Davenport, IA 52807 and is currently estimated at $9,469,978, approximately $294 per square foot. 4301 E 53rd St Unit 301 is a home located in Scott County with nearby schools including Paul Norton Elementary School, Bettendorf Middle School, and Bettendorf High School.
Ownership History
Date
Name
Owned For
Owner Type
Purchase Details
Closed on
Dec 16, 2022
Sold by
Rosales-Moreno Juan
Bought by
American Bank And Trust Company Na
Current Estimated Value
Purchase Details
Closed on
Aug 1, 2016
Sold by
Geifman Food Stores Inc
Bought by
Utica Ridge Office Rg Llc
Purchase Details
Closed on
Jul 11, 2012
Sold by
Sa Group Properties Inc
Bought by
Jco Properties Inc
Purchase Details
Closed on
Sep 15, 2011
Sold by
Ibsn Inc
Bought by
S A Group Properties Inc
Home Financials for this Owner
Home Financials are based on the most recent Mortgage that was taken out on this home.
Original Mortgage
$4,240,000
Interest Rate
4.4%
Mortgage Type
Commercial
Purchase Details
Closed on
Aug 30, 2011
Sold by
Knab 4 L L C
Bought by
Financial District Properties Db L L C
Home Financials for this Owner
Home Financials are based on the most recent Mortgage that was taken out on this home.
Original Mortgage
$4,240,000
Interest Rate
4.4%
Mortgage Type
Commercial
Create a Home Valuation Report for This Property
The Home Valuation Report is an in-depth analysis detailing your home's value as well as a comparison with similar homes in the area
Home Values in the Area
Average Home Value in this Area
Purchase History
| Date | Buyer | Sale Price | Title Company |
|---|---|---|---|
| American Bank And Trust Company Na | -- | -- | |
| Utica Ridge Office Rg Llc | $3,029,000 | None Available | |
| Jco Properties Inc | $515,000 | First American Title Ins Co | |
| S A Group Properties Inc | -- | None Available | |
| Financial District Properties Db L L C | $5,300,000 | None Available |
Source: Public Records
Mortgage History
| Date | Status | Borrower | Loan Amount |
|---|---|---|---|
| Previous Owner | Financial District Properties Db L L C | $4,240,000 |
Source: Public Records
Tax History Compared to Growth
Tax History
| Year | Tax Paid | Tax Assessment Tax Assessment Total Assessment is a certain percentage of the fair market value that is determined by local assessors to be the total taxable value of land and additions on the property. | Land | Improvement |
|---|---|---|---|---|
| 2024 | $174,542 | $5,347,990 | $1,458,310 | $3,889,680 |
| 2023 | $177,804 | $5,347,990 | $1,458,310 | $3,889,680 |
| 2022 | $177,089 | $5,477,060 | $1,458,310 | $4,018,750 |
| 2021 | $176,850 | $5,477,060 | $1,458,310 | $4,018,750 |
| 2020 | $179,662 | $5,477,060 | $1,458,310 | $4,018,750 |
| 2019 | $176,470 | $5,360,000 | $1,458,310 | $3,901,690 |
| 2018 | $180,126 | $5,360,000 | $1,458,310 | $3,901,690 |
| 2017 | $168,300 | $5,360,000 | $1,458,310 | $3,901,690 |
| 2016 | $157,142 | $4,701,800 | $0 | $0 |
| 2015 | $156,820 | $4,701,800 | $0 | $0 |
| 2014 | $159,186 | $4,701,800 | $0 | $0 |
| 2013 | $170,152 | $0 | $0 | $0 |
| 2012 | -- | $4,701,800 | $1,192,300 | $3,509,500 |
Source: Public Records
Map
Nearby Homes
- 1918 E 59th Ct
- 1912 E 59th Ct
- 1906 E 59th Ct
- 4554 Bunker Hill Dr
- 4490 Hamilton Dr
- 9 E 61st Ct
- 4150 E 60th St Unit 1004
- 4735 Stone Haven Ct
- 1908 Katie Ct
- 1708 E 59th Ct
- 1816 E 59th Ct
- 1810 E 59th Ct
- 1804 E 59th Ct
- 1714 E 59th Ct
- 1705 E 59th Ct
- 1711 E 59th Ct
- 1717 E 59th Ct
- 1807 E 59th Ct
- 1813 E 59th Ct
- 1814 Katie Ct
- 4301 E 53rd St
- 4301 E 53rd St Unit 302
- 4301 E 53rd St Unit 3rd Floor
- 4301 E 53rd St Unit 2 flr
- 4305 E 53rd St
- 5144 Coventry Ct
- 5195 Utica Ridge Rd
- 5140 Coventry Ct
- 4314 E 53rd St Unit 4316
- 4314 E 53rd St Unit 4340
- 4314 E 53rd St Unit 4320
- 4314 E 53rd St
- 5187 Utica Ridge Rd
- 5187 Utica Ridge Rd
- 5145 Coventry Ct
- 5134 Coventry Ct
- 5185 Utica Ridge Rd
- 5141 Coventry Ct
- 5128 Coventry Ct
- 5183 Utica Ridge Rd