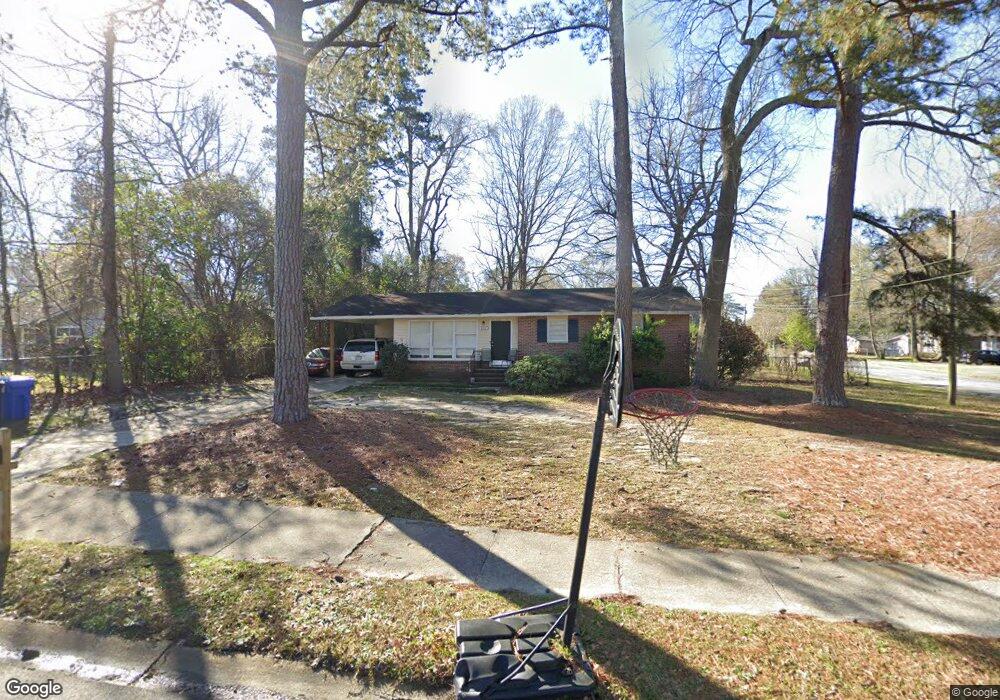
4302 Empire St Columbus, GA 31907
Eastern Columbus NeighborhoodEstimated Value: $119,000 - $132,657
3
Beds
2
Baths
1,099
Sq Ft
$114/Sq Ft
Est. Value
About This Home
This home is located at 4302 Empire St, Columbus, GA 31907 and is currently estimated at $125,664, approximately $114 per square foot. 4302 Empire St is a home located in Muscogee County with nearby schools including Lonnie Jackson Academy, Rothschild Leadership Academy, and Kendrick High School.
Ownership History
Date
Name
Owned For
Owner Type
Purchase Details
Closed on
Dec 23, 2020
Sold by
Freaky Fast Home Buyers And Investments
Bought by
Bowen Thomas B
Current Estimated Value
Home Financials for this Owner
Home Financials are based on the most recent Mortgage that was taken out on this home.
Original Mortgage
$66,000
Outstanding Balance
$58,760
Interest Rate
2.7%
Mortgage Type
New Conventional
Estimated Equity
$66,904
Purchase Details
Closed on
Sep 24, 2020
Sold by
913 Investments Llc
Bought by
Freaky Fast Home Buyers And Investments
Purchase Details
Closed on
Apr 30, 2013
Sold by
Russell Chance
Bought by
913 Investments Llc
Purchase Details
Closed on
Jun 2, 2011
Sold by
Sec Of Housing & U
Bought by
Russell Chance and Diponzio Nicholas
Purchase Details
Closed on
Nov 2, 2010
Sold by
Georgia Housing & Finance Authority
Bought by
Secretary Of Housing & Urban Development
Create a Home Valuation Report for This Property
The Home Valuation Report is an in-depth analysis detailing your home's value as well as a comparison with similar homes in the area
Home Values in the Area
Average Home Value in this Area
Purchase History
| Date | Buyer | Sale Price | Title Company |
|---|---|---|---|
| Bowen Thomas B | $82,500 | -- | |
| Freaky Fast Home Buyers And Investments | $61,500 | -- | |
| 913 Investments Llc | $60,000 | -- | |
| Russell Chance | $26,110 | -- | |
| Secretary Of Housing & Urban Development | -- | None Available | |
| Georgia Housing & Finance Authority | $59,199 | None Available |
Source: Public Records
Mortgage History
| Date | Status | Borrower | Loan Amount |
|---|---|---|---|
| Open | Bowen Thomas B | $66,000 |
Source: Public Records
Tax History Compared to Growth
Tax History
| Year | Tax Paid | Tax Assessment Tax Assessment Total Assessment is a certain percentage of the fair market value that is determined by local assessors to be the total taxable value of land and additions on the property. | Land | Improvement |
|---|---|---|---|---|
| 2025 | $1,849 | $47,240 | $7,464 | $39,776 |
| 2024 | $1,849 | $47,240 | $7,464 | $39,776 |
| 2023 | $1,861 | $47,240 | $7,464 | $39,776 |
| 2022 | $1,544 | $37,812 | $7,464 | $30,348 |
| 2021 | $1,306 | $31,992 | $7,464 | $24,528 |
| 2020 | $972 | $23,796 | $7,464 | $16,332 |
| 2019 | $975 | $23,796 | $7,464 | $16,332 |
| 2018 | $975 | $23,796 | $7,464 | $16,332 |
| 2017 | $3,522 | $23,796 | $7,464 | $16,332 |
| 2016 | $990 | $24,000 | $3,668 | $20,332 |
| 2015 | $396 | $24,000 | $3,668 | $20,332 |
| 2014 | $397 | $24,000 | $3,668 | $20,332 |
| 2013 | -- | $33,000 | $3,668 | $29,332 |
Source: Public Records
Map
Nearby Homes
- 1110 Woodburn Dr
- 920 Ashland Ave
- 1122 Woodburn Ct
- 869 Goodson Dr
- 939 Pembrook Dr
- 960 Lake Rushin Dr
- 1433 Kevin Ct
- 1404 Hunt Ave
- 813 Wright Dr
- 815 Englewood Dr
- 1544 Celia Dr
- 754 Wright Dr
- 4804 Bruning St
- 1618 Forestside Dr
- 4935 Buena Vista Rd
- 766 Cardinal Ave
- 4903 Chapman St
- 4630 Gardiner Dr
- 1674 Forestside Dr
- 4459 Bermuda St
- 4310 Empire St
- 1022 Piedmont Dr
- 4234 Empire St
- 4314 Empire St
- 4301 Empire St
- 1016 Piedmont Dr
- 1023 Piedmont Dr
- 4311 Empire St
- 1031 Celia Dr
- 4235 Empire St
- 1025 Celia Dr
- 4226 Empire St
- 1072 Piedmont Dr
- 1010 Piedmont Dr
- 4315 Empire St
- 4326 Empire St
- 1052 Piedmont Dr
- 1019 Celia Dr
- 1009 Piedmont Dr
- 4321 Empire St