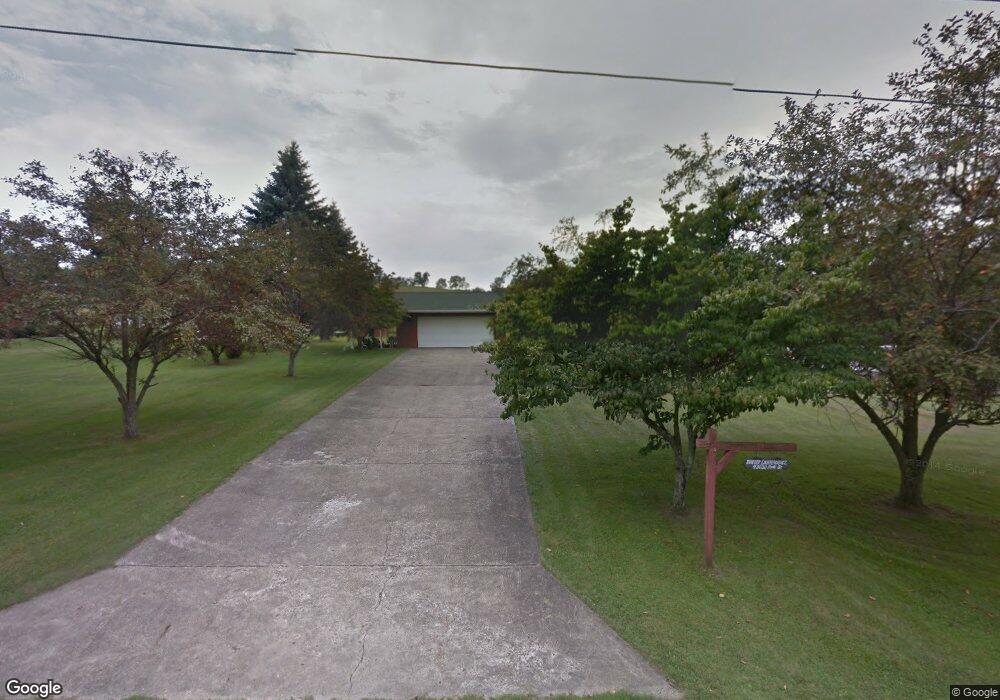
43030 Pines St Lafferty, OH 43951
Estimated Value: $103,000 - $150,000
3
Beds
2
Baths
1,120
Sq Ft
$113/Sq Ft
Est. Value
About This Home
This home is located at 43030 Pines St, Lafferty, OH 43951 and is currently estimated at $126,500, approximately $112 per square foot. 43030 Pines St is a home with nearby schools including Union Local Elementary School, Union Local Middle School, and Union Local High School.
Ownership History
Date
Name
Owned For
Owner Type
Purchase Details
Closed on
Apr 19, 2004
Sold by
Filter David Edward and Filter Dou
Bought by
Filter David Edward and Filter Dou
Current Estimated Value
Purchase Details
Closed on
Apr 9, 2003
Sold by
Lichterowicz Catherine El
Bought by
Lichterowicz Catherine El
Purchase Details
Closed on
Nov 30, 2001
Sold by
Lichterowicz Catherine El
Bought by
Lichterowicz Catherine El
Purchase Details
Closed on
Nov 8, 2001
Sold by
Lichterowicz Catherine El
Bought by
Lichterowicz Catherine El
Purchase Details
Closed on
Aug 18, 2000
Sold by
Heller Elizabeth Ann
Bought by
Heller Elizabeth Ann
Purchase Details
Closed on
Dec 16, 1999
Sold by
Lichterowicz Catherine E
Bought by
Lichterowicz Catherine E
Purchase Details
Closed on
Feb 4, 1994
Sold by
Lichterowicz Waclaw and Lichterowicz Cat
Bought by
Lichterowicz Waclaw and Lichterowicz Cat
Purchase Details
Closed on
Jan 1, 1986
Sold by
Lichterowicz Waclaw
Bought by
Lichterowicz Waclaw
Create a Home Valuation Report for This Property
The Home Valuation Report is an in-depth analysis detailing your home's value as well as a comparison with similar homes in the area
Purchase History
| Date | Buyer | Sale Price | Title Company |
|---|---|---|---|
| Filter David Edward | -- | -- | |
| Lichterowicz Catherine El | -- | -- | |
| Lichterowicz Catherine El | -- | -- | |
| Lichterowicz Catherine El | -- | -- | |
| Heller Elizabeth Ann | -- | -- | |
| Lichterowicz Catherine E | -- | -- | |
| Lichterowicz Waclaw | -- | -- | |
| Lichterowicz Waclaw | -- | -- |
Source: Public Records
Tax History
| Year | Tax Paid | Tax Assessment Tax Assessment Total Assessment is a certain percentage of the fair market value that is determined by local assessors to be the total taxable value of land and additions on the property. | Land | Improvement |
|---|---|---|---|---|
| 2025 | $1,300 | $52,000 | $2,910 | $49,090 |
| 2023 | $1,236 | $47,850 | $2,310 | $45,540 |
| 2022 | $1,249 | $47,845 | $2,310 | $45,535 |
| 2021 | $1,243 | $47,845 | $2,310 | $45,535 |
| 2020 | $1,094 | $41,620 | $2,010 | $39,610 |
| 2019 | $1,097 | $41,620 | $2,010 | $39,610 |
| 2018 | $1,139 | $41,620 | $2,010 | $39,610 |
| 2017 | $1,187 | $43,280 | $2,490 | $40,790 |
| 2016 | $1,191 | $43,280 | $2,490 | $40,790 |
| 2015 | $1,229 | $43,280 | $2,490 | $40,790 |
| 2014 | $1,006 | $36,830 | $2,260 | $34,570 |
| 2013 | $982 | $36,830 | $2,260 | $34,570 |
Source: Public Records
Map
Nearby Homes
- 71770 Chini Orchard Rd
- 19 acres Saffell Rd
- 15 acres Saffell Rd
- 70090 Main St
- 68895 Lloydsville Bannock Rd
- 0 Moriah Dr Unit 5177567
- 67174 Pancoast Rd S
- 44701 Springbrook Dr
- 44290 Denise Ln
- 41152 Black Oak Rd
- INLOT 19 Havenwood
- 117 A&B High St
- 125 Chaplins Ln
- 66164 Belmont Morristown Rd
- 39775 Rosemary Camp Rd
- 0 Watson Rd Unit 5068291
- 408 W Main St
- 67137 Airport Rd
- 67541 W Almar Ln
- 67755 W Almar Ln
- 43020 Pine St
- 43008 Pine St
- 43106 Pine St
- 43106 Pine St
- 69988 Oak Hill Rd
- 43038 Pine St
- 43038 Pine St
- 43128 Pine St
- 43006 Mount Hope Rd
- 43038 Mount Hope Rd
- 43056 Mt Hope Rd
- 42986 Mount Hope Rd
- 70010 First St Lafferty
- 43042 Mt Hope Rd
- 43056 Mount Hope Rd
- 42979 Mount Hope Rd
- 70042 First St
- 70058 1st St
- 70031 1st St
- 42959 Mount Hope Rd
Your Personal Tour Guide
Ask me questions while you tour the home.