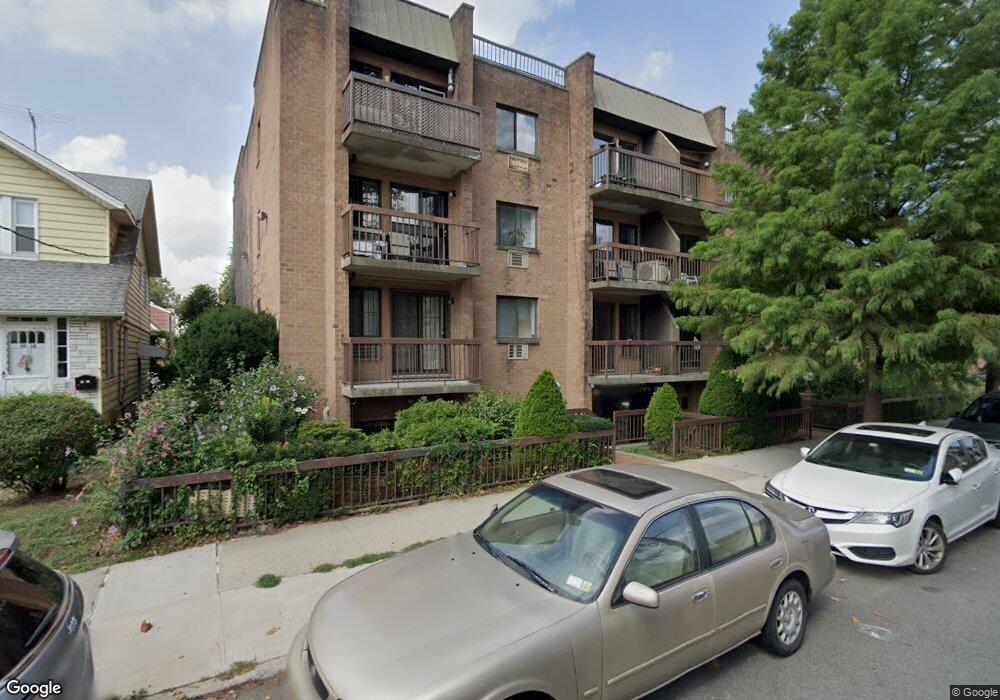
4304 158th St Unit 1D Flushing, NY 11358
Flushing NeighborhoodEstimated Value: $448,034 - $785,000
1
Bed
1
Bath
697
Sq Ft
$820/Sq Ft
Est. Value
About This Home
This home is located at 4304 158th St Unit 1D, Flushing, NY 11358 and is currently estimated at $571,509, approximately $819 per square foot. 4304 158th St Unit 1D is a home located in Queens County with nearby schools including P.S. 22 - Thomas Jefferson, Francis Lewis High School, and St. Andrew Avellino Catholic Academy.
Ownership History
Date
Name
Owned For
Owner Type
Purchase Details
Closed on
Nov 17, 2021
Sold by
Baek Hyong Un
Bought by
Yuen Ho Lam
Current Estimated Value
Purchase Details
Closed on
Dec 21, 2004
Sold by
Seo Jung Ok
Bought by
Han Oh Dong
Home Financials for this Owner
Home Financials are based on the most recent Mortgage that was taken out on this home.
Original Mortgage
$208,000
Interest Rate
5.75%
Mortgage Type
Purchase Money Mortgage
Purchase Details
Closed on
Oct 4, 2002
Sold by
Chong Linda
Bought by
Seo Jung Ok
Purchase Details
Closed on
Oct 21, 1999
Sold by
Schweppe Egon and Windle Douglas H
Bought by
Chong Linda
Home Financials for this Owner
Home Financials are based on the most recent Mortgage that was taken out on this home.
Original Mortgage
$88,500
Interest Rate
7.98%
Create a Home Valuation Report for This Property
The Home Valuation Report is an in-depth analysis detailing your home's value as well as a comparison with similar homes in the area
Home Values in the Area
Average Home Value in this Area
Purchase History
| Date | Buyer | Sale Price | Title Company |
|---|---|---|---|
| Yuen Ho Lam | $520,000 | -- | |
| Han Oh Dong | $262,000 | -- | |
| Seo Jung Ok | -- | -- | |
| Chong Linda | $118,000 | Fidelity National Title Ins |
Source: Public Records
Mortgage History
| Date | Status | Borrower | Loan Amount |
|---|---|---|---|
| Previous Owner | Han Oh Dong | $208,000 | |
| Previous Owner | Chong Linda | $88,500 |
Source: Public Records
Tax History Compared to Growth
Tax History
| Year | Tax Paid | Tax Assessment Tax Assessment Total Assessment is a certain percentage of the fair market value that is determined by local assessors to be the total taxable value of land and additions on the property. | Land | Improvement |
|---|---|---|---|---|
| 2025 | $5,015 | $38,396 | $6,222 | $32,174 |
| 2024 | $5,015 | $40,116 | $6,222 | $33,894 |
| 2023 | $4,926 | $39,402 | $6,222 | $33,180 |
| 2022 | $4,589 | $38,667 | $6,222 | $32,445 |
| 2021 | $3,112 | $35,288 | $6,222 | $29,066 |
| 2020 | $3,081 | $40,453 | $6,222 | $34,231 |
| 2019 | $3,950 | $39,342 | $6,222 | $33,120 |
| 2018 | $3,593 | $28,252 | $6,222 | $22,030 |
| 2017 | $3,307 | $25,999 | $6,222 | $19,777 |
| 2016 | $3,188 | $25,999 | $6,222 | $19,777 |
| 2015 | $1,524 | $22,949 | $6,221 | $16,728 |
| 2014 | $1,524 | $21,499 | $6,223 | $15,276 |
Source: Public Records
Map
Nearby Homes
- 4304 158th St Unit L4
- 43-04 158th St Unit L2
- 43-04 158th St Unit 3E
- 42-60 157th St Unit 3D
- 42-20 158th St
- 43-23 156th St
- 42-36 156th St
- 16001 Sanford Ave
- 16003 Sanford Ave
- 154-21 Ash Ave
- 155-17 Sanford Ave Unit 6D
- 155-17 Sanford Ave Unit 2F
- 4344 161st St
- 42-16 162nd St
- 15416 Barclay Ave
- 45-11 157th St
- 43-7 162nd St
- 149-63 Ash Ave
- 40-25 158th St
- 45-11 160th St
- 43-04 158th St Unit L4
- 43-04 158th St Unit 2E
- 4304 158th St Unit 1 A
- 43-04 158th St Unit 1B&P07
- 4304 158th St Unit 2 A
- 43-04 158th St Unit 3D
- 43-04 158th St
- 43-04 158th St Unit 2A
- 43-04 158th St Unit 1D
- 4304 158th St Unit 2 B
- 43-04 158th St Unit 2 B
- 4304 158th St Unit 3E
- 4304 158th St Unit 3D
- 4304 158th St Unit 3C
- 4304 158th St Unit 3B
- 4304 158th St Unit 3A
- 4304 158th St Unit 2E
- 4304 158th St Unit 2D
- 4304 158th St Unit 2C
- 4304 158th St Unit 2B