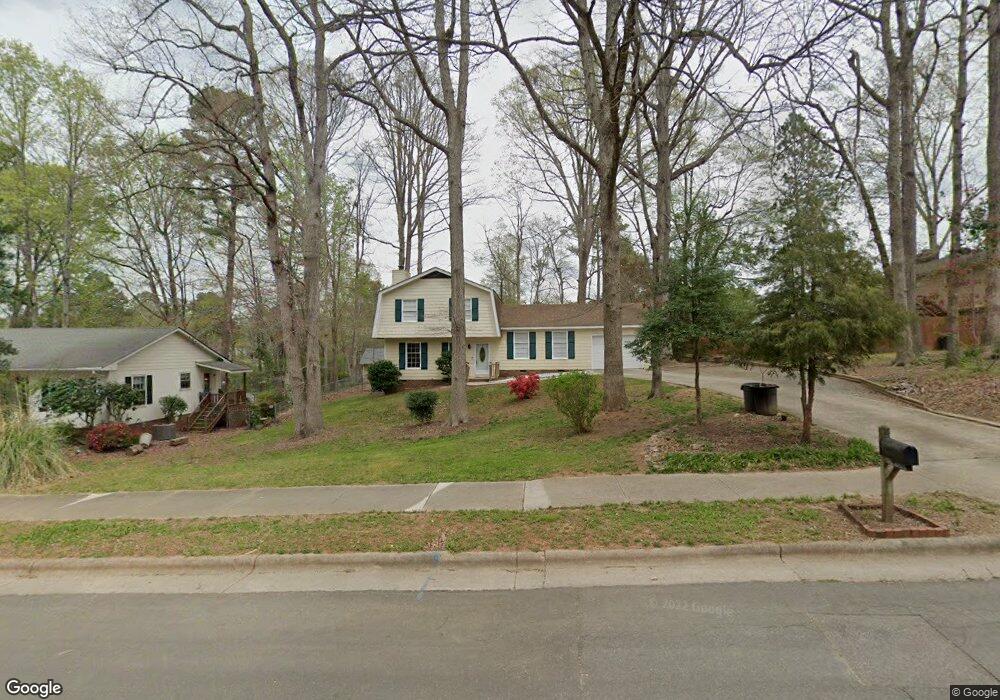
4304 Old Colony Rd Raleigh, NC 27613
Estimated Value: $408,000 - $468,055
4
Beds
3
Baths
1,851
Sq Ft
$236/Sq Ft
Est. Value
About This Home
This home is located at 4304 Old Colony Rd, Raleigh, NC 27613 and is currently estimated at $437,264, approximately $236 per square foot. 4304 Old Colony Rd is a home located in Wake County with nearby schools including York Elementary School, Leesville Road Middle School, and Leesville Road High School.
Ownership History
Date
Name
Owned For
Owner Type
Purchase Details
Closed on
Jul 9, 2021
Sold by
Nesbitt Robert Galang and Nesbitt Victoria Lyn
Bought by
Nesbitt Robert Galang
Current Estimated Value
Purchase Details
Closed on
Jun 30, 2015
Sold by
Conklin Jennifer Anne and Hensley John Paul
Bought by
Nesbitt Robert G and Poisella Victoria Lyn
Home Financials for this Owner
Home Financials are based on the most recent Mortgage that was taken out on this home.
Original Mortgage
$6,256
Outstanding Balance
$4,883
Interest Rate
3.89%
Mortgage Type
Unknown
Estimated Equity
$432,381
Purchase Details
Closed on
Apr 30, 2009
Sold by
Conklin Craig
Bought by
Conklin Jennifer Anne
Purchase Details
Closed on
Sep 30, 2005
Sold by
Ferrell Robert N and Ferrell Nancy J
Bought by
Conklin Craig and Conklin Jennifer Anne
Home Financials for this Owner
Home Financials are based on the most recent Mortgage that was taken out on this home.
Original Mortgage
$175,503
Interest Rate
5.77%
Mortgage Type
FHA
Create a Home Valuation Report for This Property
The Home Valuation Report is an in-depth analysis detailing your home's value as well as a comparison with similar homes in the area
Home Values in the Area
Average Home Value in this Area
Purchase History
| Date | Buyer | Sale Price | Title Company |
|---|---|---|---|
| Nesbitt Robert Galang | -- | None Available | |
| Nesbitt Robert G | $215,000 | North American Title Ins Co | |
| Conklin Jennifer Anne | -- | None Available | |
| Conklin Craig | $177,000 | None Available |
Source: Public Records
Mortgage History
| Date | Status | Borrower | Loan Amount |
|---|---|---|---|
| Open | Nesbitt Robert G | $6,256 | |
| Open | Nesbitt Robert G | $208,550 | |
| Previous Owner | Conklin Craig | $175,503 |
Source: Public Records
Tax History Compared to Growth
Tax History
| Year | Tax Paid | Tax Assessment Tax Assessment Total Assessment is a certain percentage of the fair market value that is determined by local assessors to be the total taxable value of land and additions on the property. | Land | Improvement |
|---|---|---|---|---|
| 2025 | $3,559 | $405,758 | $200,000 | $205,758 |
| 2024 | $3,544 | $405,758 | $200,000 | $205,758 |
| 2023 | $2,601 | $236,799 | $86,000 | $150,799 |
| 2022 | $2,418 | $236,799 | $86,000 | $150,799 |
| 2021 | $2,324 | $236,799 | $86,000 | $150,799 |
| 2020 | $2,282 | $236,799 | $86,000 | $150,799 |
| 2019 | $2,356 | $201,588 | $83,000 | $118,588 |
| 2018 | $2,223 | $201,588 | $83,000 | $118,588 |
| 2017 | $2,117 | $201,588 | $83,000 | $118,588 |
| 2016 | $2,074 | $201,588 | $83,000 | $118,588 |
| 2015 | $1,941 | $185,531 | $66,000 | $119,531 |
| 2014 | $1,842 | $185,531 | $66,000 | $119,531 |
Source: Public Records
Map
Nearby Homes
- 6420 Tanner Oak Ln
- 6422 Tanner Oak Ln
- 6408 Tanner Oak Ln
- 6928 Leesville Rd
- 6648 Mafolie Ct
- 104 Oak Hollow Ct Unit 104
- 401 Oak Hollow Ct Unit 401
- 202 Oak Hollow Ct
- 4403 Sunburst Ct
- 6600 Coach Light Cir
- 204 Autumn Chase Dr Unit 204
- 6140 Loch Laural Ln
- 4541 Hershey Ct
- 6736 Hammersmith Dr
- 4350 Pine Springs Ct
- 4536 Hamptonshire Dr
- 3611 Plumbridge Ct
- 4649 Pine Trace Dr
- 5904 Deblyn Ave
- 4424 Tetbury Place
- 4308 Old Colony Rd
- 4008 Grimstead Ln
- 4004 Grimstead Ln
- 4312 Old Colony Rd
- 4309 Pickwick Dr
- 4305 Pickwick Dr
- 4012 Grimstead Ln
- 4313 Pickwick Dr
- 4301 Pickwick Dr
- 4305 Old Colony Rd
- 4309 Old Colony Rd
- 4316 Old Colony Rd
- 4317 Pickwick Dr
- 4016 Grimstead Ln
- 4009 Grimstead Ln
- 4005 Grimstead Ln
- 4313 Old Colony Rd
- 4013 Grimstead Ln
- 4321 Pickwick Dr
- 4209 Pickwick Dr