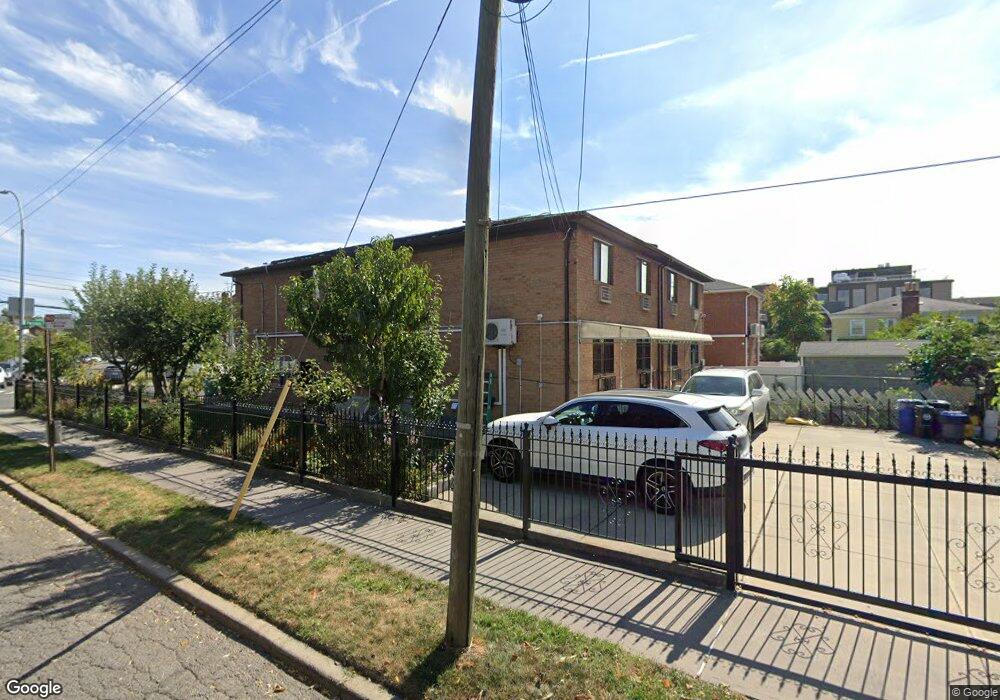
4304 Parsons Blvd Unit FL 2 Flushing, NY 11355
Flushing NeighborhoodEstimated Value: $1,839,000 - $2,925,000
3
Beds
2
Baths
1,233
Sq Ft
$1,832/Sq Ft
Est. Value
About This Home
This home is located at 4304 Parsons Blvd Unit FL 2, Flushing, NY 11355 and is currently estimated at $2,258,333, approximately $1,831 per square foot. 4304 Parsons Blvd Unit FL 2 is a home located in Queens County with nearby schools including P.S. 024 Andrew Jackson School, Rachel Carson I.S. 237Q, and John Bowne High School.
Ownership History
Date
Name
Owned For
Owner Type
Purchase Details
Closed on
Aug 27, 2021
Sold by
Shum Ai Chin and Shum David
Bought by
Angela Shum 2021 Revocable Management Tr and Angela Shum, As Co-Trustee
Current Estimated Value
Purchase Details
Closed on
Aug 27, 1985
Sold by
Levant Homes Inc
Bought by
Shum Ai Chin and Shum David
Create a Home Valuation Report for This Property
The Home Valuation Report is an in-depth analysis detailing your home's value as well as a comparison with similar homes in the area
Home Values in the Area
Average Home Value in this Area
Purchase History
| Date | Buyer | Sale Price | Title Company |
|---|---|---|---|
| Angela Shum 2021 Revocable Management Tr | -- | -- | |
| Shum Ai Chin | -- | -- |
Source: Public Records
Tax History Compared to Growth
Tax History
| Year | Tax Paid | Tax Assessment Tax Assessment Total Assessment is a certain percentage of the fair market value that is determined by local assessors to be the total taxable value of land and additions on the property. | Land | Improvement |
|---|---|---|---|---|
| 2025 | $13,113 | $70,685 | $16,887 | $53,798 |
| 2024 | $11,190 | $66,686 | $15,693 | $50,993 |
| 2023 | $13,113 | $66,686 | $15,132 | $51,554 |
| 2022 | $9,694 | $112,380 | $25,500 | $86,880 |
| 2021 | $12,844 | $95,220 | $25,500 | $69,720 |
| 2020 | $12,172 | $91,200 | $25,500 | $65,700 |
| 2019 | $11,332 | $100,440 | $25,500 | $74,940 |
| 2018 | $11,031 | $55,572 | $13,967 | $41,605 |
| 2017 | $10,943 | $55,153 | $16,519 | $38,634 |
| 2016 | $10,092 | $55,153 | $16,519 | $38,634 |
| 2015 | $6,056 | $49,087 | $22,235 | $26,852 |
| 2014 | $6,056 | $46,310 | $25,182 | $21,128 |
Source: Public Records
Map
Nearby Homes
- 4341 Burling St
- 143-37 Beech Ave
- 4223 Parsons Blvd Unit 1E
- 4223 Parsons Blvd Unit 5D
- 14716 Cherry Ave
- 42-11 Parsons Blvd Unit Parking
- 42-11 Parsons Blvd Unit 4D
- 42-11 Parsons Blvd Unit 4B
- 42-11 Parsons Blvd Unit 2D
- 143-22 Beech Ave
- 42-26 147th St Unit 5B
- 42-05 Parsons Blvd Unit 4A
- 42-18 147th St Unit 4A
- 14430 Sanford Ave Unit 4T
- 4218 147th St Unit 2E
- 4218 147th St Unit 3J
- 14340 Franklin Ave
- 144-54 Sanford Ave Unit 38
- 144-44 Sanford Ave Unit 3
- 144-44 Sanford Ave Unit 3H
- 4304 Parsons Blvd
- 43-04 Parsons Blvd Unit Fl 1
- 43-04 Parsons Blvd Unit 1F
- 43-04 Parsons Blvd Unit 2F
- 4306 Parsons Blvd
- 43-06 Parsons Blvd
- 14372 Cherry Ave
- 4310 Parsons Blvd
- 146-06 Cherry Ave Unit 3rd Fl
- 43-10 Parsons Blvd
- 43-10 Parsons Blvd Unit 2FL
- 42-70 Cherry Ave
- 14368 Cherry Ave
- 43-12 Parsons Blvd Unit 2Fl
- 43-12 Parsons Blvd
- 4312 Parsons Blvd
- 4268 Parsons Blvd
- 14366 Cherry Ave
- 143-72 Cherry Ave
- 14621 Delaware Ave