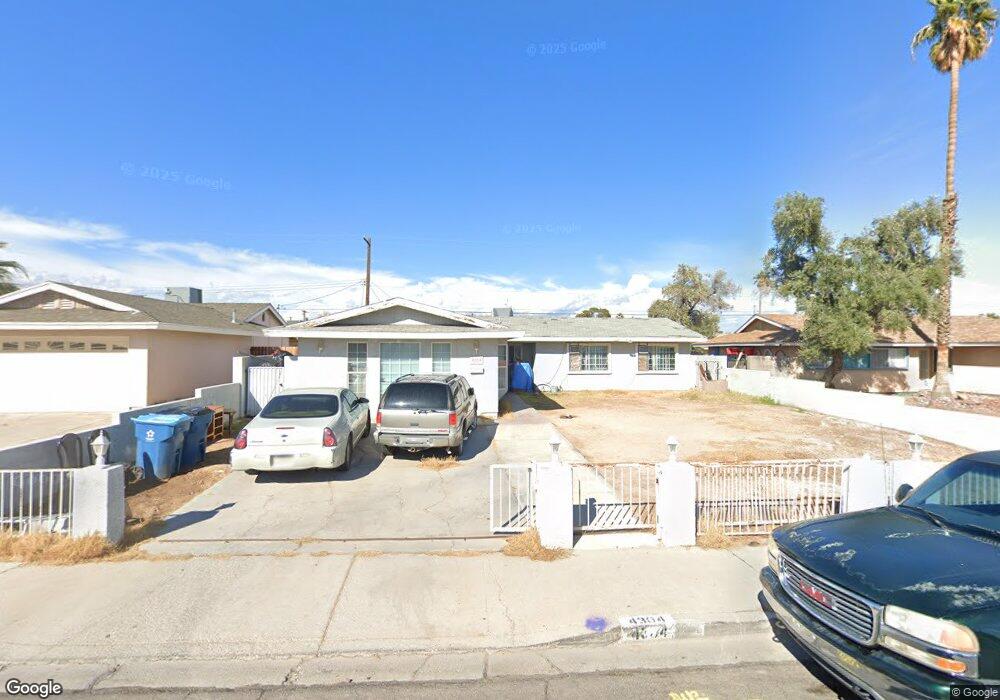
4304 Via Vaquero Ave Las Vegas, NV 89102
Buffalo NeighborhoodEstimated Value: $355,793 - $407,000
4
Beds
2
Baths
1,680
Sq Ft
$224/Sq Ft
Est. Value
About This Home
This home is located at 4304 Via Vaquero Ave, Las Vegas, NV 89102 and is currently estimated at $375,698, approximately $223 per square foot. 4304 Via Vaquero Ave is a home located in Clark County with nearby schools including Vegas Verdes Elementary School, Hyde Park Middle School, and Ed W Clark High School.
Ownership History
Date
Name
Owned For
Owner Type
Purchase Details
Closed on
Apr 18, 2003
Sold by
Boston Leasing Co Ltd Llc
Bought by
Landeros Martinez Benito
Current Estimated Value
Home Financials for this Owner
Home Financials are based on the most recent Mortgage that was taken out on this home.
Original Mortgage
$141,186
Outstanding Balance
$59,716
Interest Rate
5.54%
Mortgage Type
FHA
Estimated Equity
$315,982
Purchase Details
Closed on
Aug 23, 1996
Sold by
Howard Robert L and Howard Maria F
Bought by
Caballero Sergio and Caballero Maria
Home Financials for this Owner
Home Financials are based on the most recent Mortgage that was taken out on this home.
Original Mortgage
$98,978
Interest Rate
8.42%
Mortgage Type
FHA
Create a Home Valuation Report for This Property
The Home Valuation Report is an in-depth analysis detailing your home's value as well as a comparison with similar homes in the area
Home Values in the Area
Average Home Value in this Area
Purchase History
| Date | Buyer | Sale Price | Title Company |
|---|---|---|---|
| Landeros Martinez Benito | $143,200 | National Title Company | |
| Boston Leasing Co Ltd Llc | $105,866 | National Title Company | |
| Caballero Sergio | $100,000 | Stewart Title |
Source: Public Records
Mortgage History
| Date | Status | Borrower | Loan Amount |
|---|---|---|---|
| Open | Landeros Martinez Benito | $141,186 | |
| Previous Owner | Caballero Sergio | $98,978 | |
| Closed | Landeros Martinez Benito | $3,000 |
Source: Public Records
Tax History Compared to Growth
Tax History
| Year | Tax Paid | Tax Assessment Tax Assessment Total Assessment is a certain percentage of the fair market value that is determined by local assessors to be the total taxable value of land and additions on the property. | Land | Improvement |
|---|---|---|---|---|
| 2025 | $1,148 | $60,251 | $37,800 | $22,451 |
| 2024 | $1,063 | $60,251 | $37,800 | $22,451 |
| 2023 | $744 | $52,904 | $32,550 | $20,354 |
| 2022 | $985 | $45,792 | $27,650 | $18,142 |
| 2021 | $1,297 | $42,421 | $25,550 | $16,871 |
| 2020 | $844 | $40,188 | $23,800 | $16,388 |
| 2019 | $791 | $34,337 | $18,550 | $15,787 |
| 2018 | $755 | $33,388 | $18,550 | $14,838 |
| 2017 | $987 | $30,107 | $15,400 | $14,707 |
| 2016 | $744 | $27,455 | $13,300 | $14,155 |
| 2015 | $705 | $22,476 | $8,750 | $13,726 |
| 2014 | $684 | $20,259 | $6,650 | $13,609 |
Source: Public Records
Map
Nearby Homes
- 4100 Via Olivero Ave
- 2521 Lenna St
- 4013 El Camino Ave
- 4313 El Conlon Ave
- 4321 El Conlon Ave
- 2205 Las Verdes St
- 2101 Las Flores St
- 2005 Fontenelle St
- 2013 Las Verdes St
- 4117 El Cederal Ave
- 2008 El Mirador St
- 3900 San Angelo Ave
- 1904 Fontenelle St
- 3713 San Bernardino Ave
- 1905 Aquarius Dr
- 4248 Tara Ave Unit 2
- 4316 Tara Ave Unit 4
- 2116 Cameron St
- 4332 Tara Ave Unit a
- 4348 Tara Ave Unit 2
- 4308 Via Vaquero Ave
- 4300 Via Vaquero Ave
- 4305 Esmeralda Ave
- 4301 Esmeralda Ave
- 4309 Esmeralda Ave
- 4216 Via Vaquero Ave
- 4312 Via Vaquero Ave
- 4221 Esmeralda Ave
- 4313 Esmeralda Ave
- 4305 Via Vaquero Ave Unit 3
- 4301 Via Vaquero Ave
- 4212 Via Vaquero Ave
- 4316 Via Vaquero Ave
- 4309 Via Vaquero Ave
- 4217 Via Vaquero Ave
- 4317 Esmeralda Ave
- 4217 Esmeralda Ave
- 4313 Via Vaquero Ave
- 4213 Via Vaquero Ave
- 4320 Via Vaquero Ave