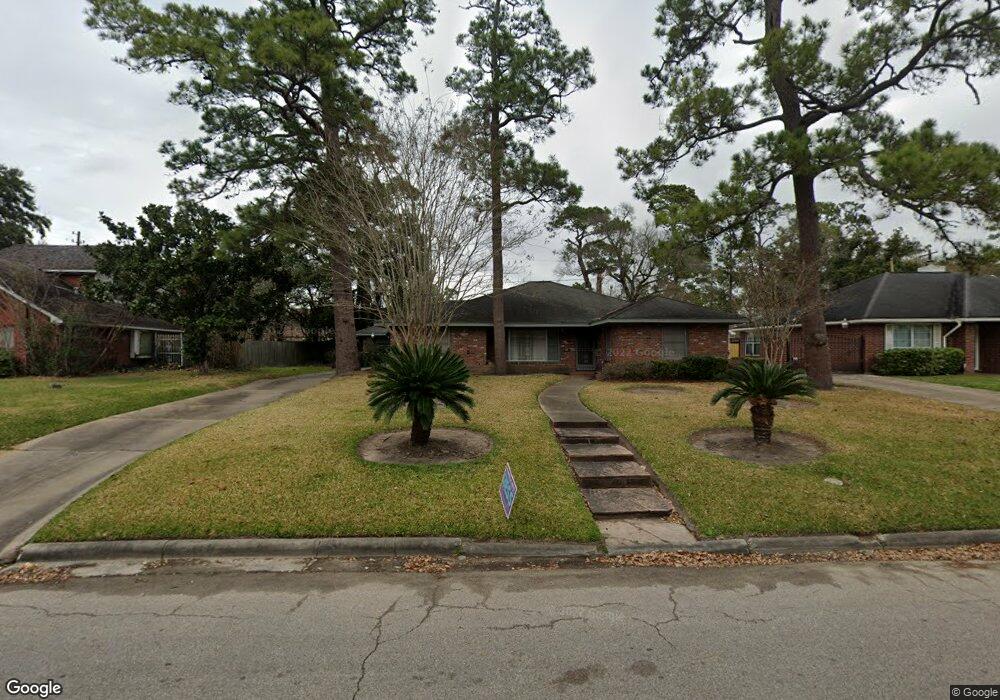
4305 Charleston St Houston, TX 77021
MacGregor NeighborhoodEstimated Value: $365,104 - $479,000
3
Beds
3
Baths
1,985
Sq Ft
$207/Sq Ft
Est. Value
About This Home
This home is located at 4305 Charleston St, Houston, TX 77021 and is currently estimated at $411,526, approximately $207 per square foot. 4305 Charleston St is a home located in Harris County with nearby schools including Peck Elementary School, Cullen Middle School, and Yates High School.
Ownership History
Date
Name
Owned For
Owner Type
Purchase Details
Closed on
Jun 30, 2005
Sold by
Barnes Allison Delphine and Barnes Allison
Bought by
Steele Christine H
Current Estimated Value
Home Financials for this Owner
Home Financials are based on the most recent Mortgage that was taken out on this home.
Original Mortgage
$132,000
Outstanding Balance
$68,950
Interest Rate
5.67%
Mortgage Type
Stand Alone First
Estimated Equity
$342,576
Purchase Details
Closed on
Feb 21, 2005
Sold by
Floyd Luther Emord
Bought by
Barnes Allison Delphine
Purchase Details
Closed on
Feb 27, 1998
Sold by
Chapa Manuel Jesse
Bought by
Floyd Luther E
Home Financials for this Owner
Home Financials are based on the most recent Mortgage that was taken out on this home.
Original Mortgage
$60,300
Interest Rate
6.91%
Purchase Details
Closed on
Feb 24, 1998
Sold by
Smith Raymond and Smith Earnestine P
Bought by
Barnes Allison
Home Financials for this Owner
Home Financials are based on the most recent Mortgage that was taken out on this home.
Original Mortgage
$60,300
Interest Rate
6.91%
Create a Home Valuation Report for This Property
The Home Valuation Report is an in-depth analysis detailing your home's value as well as a comparison with similar homes in the area
Home Values in the Area
Average Home Value in this Area
Purchase History
| Date | Buyer | Sale Price | Title Company |
|---|---|---|---|
| Steele Christine H | -- | American Title Co | |
| Barnes Allison Delphine | -- | -- | |
| Floyd Luther E | -- | -- | |
| Barnes Allison | -- | -- | |
| Barnes Allison | -- | -- |
Source: Public Records
Mortgage History
| Date | Status | Borrower | Loan Amount |
|---|---|---|---|
| Open | Steele Christine H | $132,000 | |
| Previous Owner | Floyd Luther E | $60,300 |
Source: Public Records
Tax History Compared to Growth
Tax History
| Year | Tax Paid | Tax Assessment Tax Assessment Total Assessment is a certain percentage of the fair market value that is determined by local assessors to be the total taxable value of land and additions on the property. | Land | Improvement |
|---|---|---|---|---|
| 2025 | $439 | $387,481 | $250,250 | $137,231 |
| 2024 | $439 | $387,481 | $250,250 | $137,231 |
| 2023 | $439 | $384,759 | $250,250 | $134,509 |
| 2022 | $7,451 | $371,216 | $250,250 | $120,966 |
| 2021 | $6,814 | $292,363 | $178,750 | $113,613 |
| 2020 | $6,961 | $274,429 | $178,750 | $95,679 |
| 2019 | $6,604 | $249,851 | $154,172 | $95,679 |
| 2018 | $1,353 | $238,430 | $134,063 | $104,367 |
| 2017 | $5,454 | $238,430 | $134,063 | $104,367 |
| 2016 | $4,958 | $238,430 | $134,063 | $104,367 |
| 2015 | $3,025 | $213,511 | $98,313 | $115,198 |
| 2014 | $3,025 | $155,000 | $98,313 | $56,687 |
Source: Public Records
Map
Nearby Homes
- 4327 Alconbury Ln
- 4310 Fernwood Dr
- 4302 Fernwood Dr
- 4211 Charleston St
- 4315 Fernwood Dr
- 4435 Old Spanish Trail
- 4107 Charleston St
- 4031 Fernwood Dr
- 0 S Macgregor Way Unit 94380145
- 4711 Marietta Ln
- 4014 England Ct E
- 4735 Marietta Ln
- 5811 Eastwood St
- 3917, 3919 Griggs Rd
- 4826 Culmore Dr
- 4807 Eppes St
- 4013 Griggs Rd Unit E
- 4013 Griggs Rd Unit D
- 3827 Julius Ln
- 4838 Marietta Ln
- 4309 Charleston St
- 4301 Charleston St
- 4306 Laurel Dr
- 4315 Charleston St
- 4302 Laurel Dr
- 4306 Charleston St
- 4310 Charleston St
- 4302 Charleston St
- 4319 Charleston St
- 4318 Laurel Dr
- 4314 Charleston St
- 4223 Charleston St
- 5540 Cullen Blvd
- 4318 Charleston St
- 4322 Laurel Dr
- 4401 Charleston St
- 4303 Alconbury Ln
- 4309 Alconbury Ln
- 4216 Charleston St
- 4301 Alconbury Ln