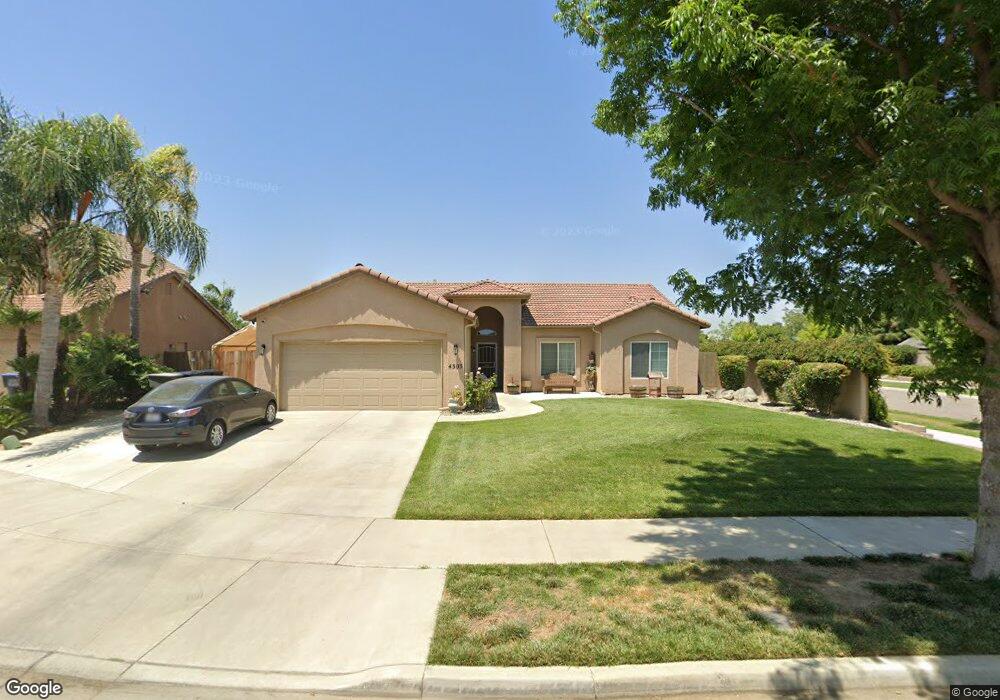
4305 S Fontana St Visalia, CA 93277
Estimated Value: $384,000 - $445,000
4
Beds
2
Baths
1,593
Sq Ft
$254/Sq Ft
Est. Value
About This Home
This home is located at 4305 S Fontana St, Visalia, CA 93277 and is currently estimated at $404,427, approximately $253 per square foot. 4305 S Fontana St is a home located in Tulare County with nearby schools including Cottonwood Creek Elementary School, La Joya Middle School, and El Diamante High School.
Ownership History
Date
Name
Owned For
Owner Type
Purchase Details
Closed on
Jan 31, 2023
Sold by
Williams Robert
Bought by
Williams Robert and Williams Kimberly A
Current Estimated Value
Purchase Details
Closed on
Jan 24, 2023
Sold by
Williams Robert
Bought by
Williams Robert and Williams Kimberly A
Purchase Details
Closed on
Sep 2, 2009
Sold by
Smee Builders Inc
Bought by
Williams Robert
Home Financials for this Owner
Home Financials are based on the most recent Mortgage that was taken out on this home.
Original Mortgage
$188,522
Interest Rate
5.2%
Mortgage Type
FHA
Purchase Details
Closed on
Jun 29, 2009
Sold by
Williams Kimberly A
Bought by
Williams Robert
Purchase Details
Closed on
Apr 27, 2009
Sold by
Zenz and Osullivan
Bought by
Gibbons 20 Llc
Purchase Details
Closed on
Apr 15, 2009
Sold by
Reynen & Bardis Communities Inc
Bought by
Zenz and Osullivan
Create a Home Valuation Report for This Property
The Home Valuation Report is an in-depth analysis detailing your home's value as well as a comparison with similar homes in the area
Home Values in the Area
Average Home Value in this Area
Purchase History
| Date | Buyer | Sale Price | Title Company |
|---|---|---|---|
| Williams Robert | -- | None Listed On Document | |
| Williams Robert | -- | -- | |
| Williams Robert | $192,000 | First American Title Company | |
| Smee Builders Inc | -- | First American Title Company | |
| Williams Robert | -- | First American Title Company | |
| Gibbons 20 Llc | $78,500 | Chicago Title Co | |
| Zenz | $52,000 | First American Title Company |
Source: Public Records
Mortgage History
| Date | Status | Borrower | Loan Amount |
|---|---|---|---|
| Previous Owner | Williams Robert | $188,522 |
Source: Public Records
Tax History Compared to Growth
Tax History
| Year | Tax Paid | Tax Assessment Tax Assessment Total Assessment is a certain percentage of the fair market value that is determined by local assessors to be the total taxable value of land and additions on the property. | Land | Improvement |
|---|---|---|---|---|
| 2025 | $2,753 | $247,835 | $58,084 | $189,751 |
| 2024 | $2,753 | $242,977 | $56,946 | $186,031 |
| 2023 | $2,682 | $238,214 | $55,830 | $182,384 |
| 2022 | $2,571 | $233,544 | $54,736 | $178,808 |
| 2021 | $2,572 | $228,965 | $53,663 | $175,302 |
| 2020 | $2,554 | $226,617 | $53,113 | $173,504 |
| 2019 | $2,484 | $222,174 | $52,072 | $170,102 |
| 2018 | $2,427 | $217,818 | $51,051 | $166,767 |
| 2017 | $2,332 | $207,000 | $52,000 | $155,000 |
| 2016 | $2,165 | $191,000 | $48,000 | $143,000 |
| 2015 | $1,889 | $180,000 | $45,000 | $135,000 |
| 2014 | $1,889 | $164,000 | $41,000 | $123,000 |
Source: Public Records
Map
Nearby Homes
- 4206 S Julieann Ct
- 4036 W Rialto Ave
- 3346 W Good Ave
- 3335 W Florence Ave
- 4246 S University St
- 4715 W Elkhorn Ave
- 4302 S Chatham St
- 4247 S University St
- 4250 S Silvervale St
- 4303 S Chatham St
- 3432 W Good Ave
- 4204 S University St
- 4546 S Dans St
- 4924 W Elkhorn Ave
- 3229 W Loyola Ave
- 3027 W Rialto Ave
- 2223 S Julieann St Unit 1032v
- 3737 W Victor Ave
- 3731 S Mountain Ct
- 3933 S Parkwood St
- 4317 S Fontana St
- 4241 S Fontana St
- 4018 W Reese Ave
- 4033 W Reese Ave
- 4017 W Reese Ave
- 4227 S Fontana St
- 4006 W Reese Ave
- 4015 W Elkhorn Ave
- 4009 W Reese Ave
- 4007 W Elkhorn Ave
- 3942 W Reese Ave
- 3947 W Reese Ave
- 4213 S Fontana St
- 3943 W Elkhorn Ave
- 3937 W Reese Ave
- 3930 W Reese Ave
- 4032 W Elkhorn Ave
- 4016 W Elkhorn Ave
- 3931 W Elkhorn Ave
- 4008 W Elkhorn Ave