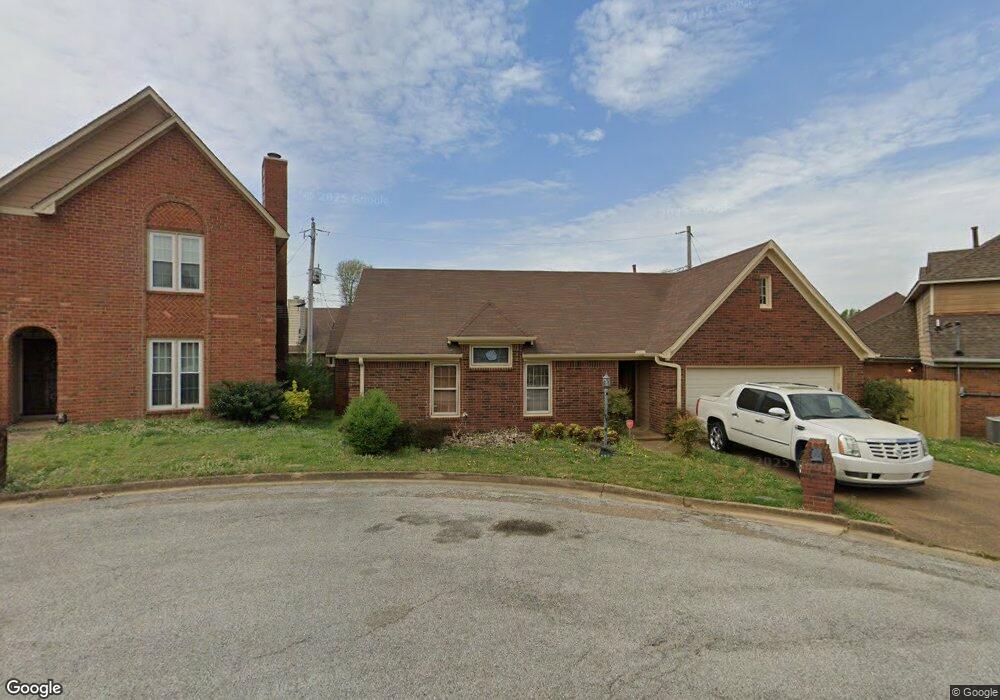
4305 Willow Way Cove Memphis, TN 38141
Hickory Hill NeighborhoodEstimated Value: $163,000 - $196,000
3
Beds
2
Baths
1,226
Sq Ft
$143/Sq Ft
Est. Value
About This Home
This home is located at 4305 Willow Way Cove, Memphis, TN 38141 and is currently estimated at $175,229, approximately $142 per square foot. 4305 Willow Way Cove is a home located in Shelby County with nearby schools including Ross Elementary School, Kirby High School, and East Academy.
Ownership History
Date
Name
Owned For
Owner Type
Purchase Details
Closed on
Sep 19, 2017
Sold by
Beasley T Tarry
Bought by
Beasley Family Trust
Current Estimated Value
Purchase Details
Closed on
Jun 5, 2012
Sold by
Griffin Greg
Bought by
Besaley T Tarry
Purchase Details
Closed on
May 22, 2012
Sold by
Mcneal Peter J and Mcneal Jacqyueline Jean
Bought by
Bank Of Americna Na
Purchase Details
Closed on
Mar 31, 2006
Sold by
Westbrooks Laura L
Bought by
Mcneal Peter J
Home Financials for this Owner
Home Financials are based on the most recent Mortgage that was taken out on this home.
Original Mortgage
$122,927
Interest Rate
6.23%
Mortgage Type
VA
Purchase Details
Closed on
Apr 16, 2004
Sold by
Becker Mary Celene
Bought by
Westbrooks Laura L
Home Financials for this Owner
Home Financials are based on the most recent Mortgage that was taken out on this home.
Original Mortgage
$105,000
Interest Rate
5.35%
Mortgage Type
Purchase Money Mortgage
Create a Home Valuation Report for This Property
The Home Valuation Report is an in-depth analysis detailing your home's value as well as a comparison with similar homes in the area
Home Values in the Area
Average Home Value in this Area
Purchase History
| Date | Buyer | Sale Price | Title Company |
|---|---|---|---|
| Beasley Family Trust | -- | None Available | |
| Besaley T Tarry | $52,500 | None Available | |
| Bank Of Americna Na | $46,709 | None Available | |
| Mcneal Peter J | $119,000 | Realty Title | |
| Westbrooks Laura L | $105,000 | Realty Title |
Source: Public Records
Mortgage History
| Date | Status | Borrower | Loan Amount |
|---|---|---|---|
| Previous Owner | Mcneal Peter J | $122,927 | |
| Previous Owner | Westbrooks Laura L | $105,000 |
Source: Public Records
Tax History Compared to Growth
Tax History
| Year | Tax Paid | Tax Assessment Tax Assessment Total Assessment is a certain percentage of the fair market value that is determined by local assessors to be the total taxable value of land and additions on the property. | Land | Improvement |
|---|---|---|---|---|
| 2025 | $898 | $42,300 | $6,600 | $35,700 |
| 2024 | $898 | $26,475 | $5,625 | $20,850 |
| 2023 | $1,613 | $26,475 | $5,625 | $20,850 |
| 2022 | $1,613 | $26,475 | $5,625 | $20,850 |
| 2021 | $1,632 | $26,475 | $5,625 | $20,850 |
| 2020 | $1,331 | $18,375 | $5,625 | $12,750 |
| 2019 | $1,331 | $18,375 | $5,625 | $12,750 |
| 2018 | $1,331 | $18,375 | $5,625 | $12,750 |
| 2017 | $830 | $20,200 | $5,625 | $14,575 |
| 2016 | $574 | $13,125 | $0 | $0 |
| 2014 | $574 | $13,125 | $0 | $0 |
Source: Public Records
Map
Nearby Homes
- 4335 Snowmass Ln
- 4304 Bear Creek Ln
- 6780 Devenshire Ln
- 4373 Lloydminster Cove
- 6799 Ross Ridge Dr
- 6893 Snyder Rd
- 4194 Wesgate Trail
- 4190 Meadow Ridge Trail
- 6623 Rocky Park Dr
- 4447 Ross Rd
- 6846 Gilford Dr
- 6988 Autumn Crest Cove
- 6879 Gilford Dr
- 6770 Seven Valley Dr
- 6842 Rockbrook Dr
- 4264 Timber Rise Rd
- 4529 Quail Ridge Trail
- 4331 Crimson Leaf Cove
- 6577 Beaverlodge Dr
- 4162 Old Village Ln
- 4299 Willow Way Cove
- 4309 Willow Way Cove
- 4310 Woody Creek Cove
- 4293 Willow Way Cove
- 4311 Woody Creek Cove
- 4313 Willow Way Cove
- 4304 Willow Way Cove
- 4308 Willow Way Cove
- 4306 Woody Creek Cove
- 4289 Willow Way Cove
- 4300 Willow Way Cove
- 4296 Willow Way Cove
- 4307 Woody Creek Cove
- 4312 Willow Way Cove
- 6786 Castlegate Cove
- 4292 Willow Way Cove
- 6790 Castlegate Cove
- 6780 Castlegate Cove
- 4303 Snowmass Ln
- 4309 Snowmass Ln