Estimated Value: $378,000 - $454,000
4
Beds
3
Baths
2,500
Sq Ft
$167/Sq Ft
Est. Value
About This Home
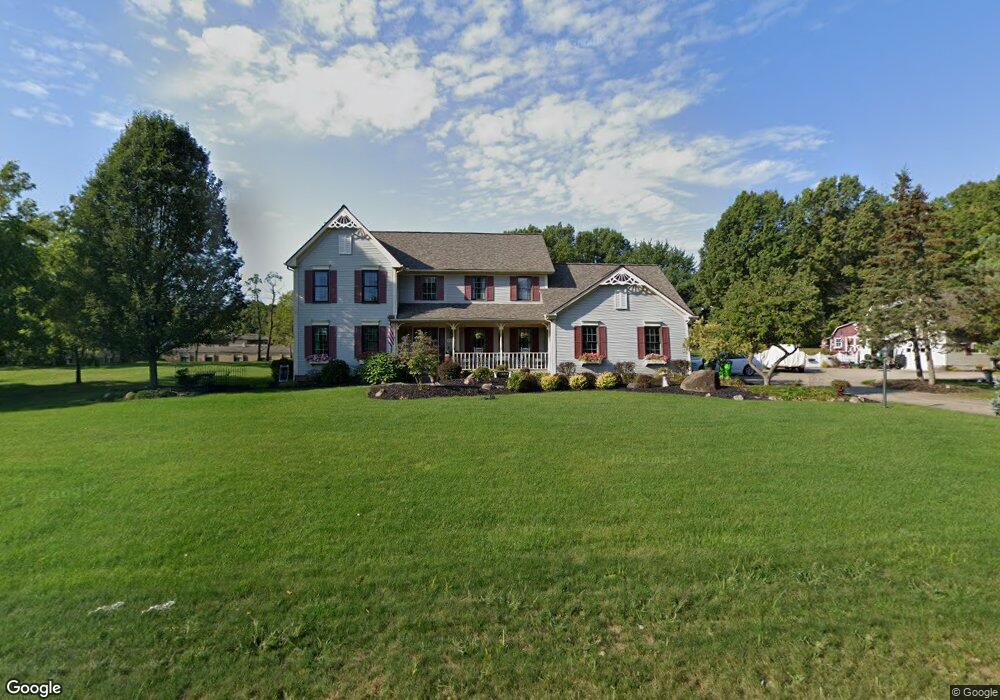
This home is located at 4306 Fishcreek Rd, Stow, OH 44224 and is currently estimated at $417,560, approximately $167 per square foot. 4306 Fishcreek Rd is a home located in Summit County with nearby schools including Stow-Munroe Falls High School and Walsh Jesuit High School.
Ownership History
Date
Name
Owned For
Owner Type
Purchase Details
Closed on
Sep 8, 2021
Sold by
Sellers Gary E and Sellers Diane L
Bought by
Mohr Jennifer and The Sellers Preservation Trust
Current Estimated Value
Purchase Details
Closed on
Aug 17, 2000
Sold by
Sellers Gary E and Sellers Diane L
Bought by
Sellers Gary E and Sellers Diane L
Purchase Details
Closed on
Apr 30, 1999
Sold by
Hibbard Edwin S and Hibbard Janice M
Bought by
Sellers Gary E and Sellers Diane L
Home Financials for this Owner
Home Financials are based on the most recent Mortgage that was taken out on this home.
Original Mortgage
$160,000
Outstanding Balance
$41,341
Interest Rate
7.04%
Estimated Equity
$376,219
Purchase Details
Closed on
Nov 9, 1995
Sold by
Schalmo Properties Inc
Bought by
Hibbard Edwin S and Hibbard Janice M
Home Financials for this Owner
Home Financials are based on the most recent Mortgage that was taken out on this home.
Original Mortgage
$140,000
Interest Rate
6.88%
Mortgage Type
New Conventional
Create a Home Valuation Report for This Property
The Home Valuation Report is an in-depth analysis detailing your home's value as well as a comparison with similar homes in the area
Home Values in the Area
Average Home Value in this Area
Purchase History
| Date | Buyer | Sale Price | Title Company |
|---|---|---|---|
| Mohr Jennifer | -- | None Available | |
| Sellers Gary E | -- | Endress/Lawyers Title | |
| Sellers Gary E | $245,000 | Affiliated Title | |
| Hibbard Edwin S | $209,900 | -- |
Source: Public Records
Mortgage History
| Date | Status | Borrower | Loan Amount |
|---|---|---|---|
| Open | Sellers Gary E | $160,000 | |
| Previous Owner | Hibbard Edwin S | $140,000 |
Source: Public Records
Tax History Compared to Growth
Tax History
| Year | Tax Paid | Tax Assessment Tax Assessment Total Assessment is a certain percentage of the fair market value that is determined by local assessors to be the total taxable value of land and additions on the property. | Land | Improvement |
|---|---|---|---|---|
| 2025 | $6,554 | $123,711 | $20,916 | $102,795 |
| 2024 | $6,554 | $123,711 | $20,916 | $102,795 |
| 2023 | $6,554 | $123,711 | $20,916 | $102,795 |
| 2022 | $5,749 | $97,185 | $16,216 | $80,969 |
| 2021 | $5,158 | $97,185 | $16,216 | $80,969 |
| 2020 | $5,071 | $97,190 | $16,220 | $80,970 |
| 2019 | $4,834 | $87,400 | $17,760 | $69,640 |
| 2018 | $4,757 | $87,400 | $17,760 | $69,640 |
| 2017 | $4,736 | $87,400 | $17,760 | $69,640 |
| 2016 | $4,872 | $84,850 | $17,760 | $67,090 |
| 2015 | $4,736 | $84,850 | $17,760 | $67,090 |
| 2014 | $4,740 | $84,850 | $17,760 | $67,090 |
| 2013 | $4,825 | $86,760 | $17,760 | $69,000 |
Source: Public Records
Map
Nearby Homes
- 2831 Saybrooke Blvd
- 4445 Kenneth Trail
- 4444 Hickory Trail
- 2714 Wexford Blvd
- 2908 Wexford Blvd
- 4556 Fishcreek Rd
- 3860 Lake Run Blvd
- 4078 Pardee Rd
- 3788 Woodbury Oval Unit 60
- 4131 Burton Dr
- 4155 Burton Dr
- 0 Vira Rd
- 3801 Baird Rd
- 4638 Dresher Trail
- 2260 E Gilwood Dr
- 3711 Vira Rd
- 3757 Seneca St
- 4910 Independence Cir Unit D
- 3682 Vira Rd
- 3961 Klein Ave
- 2721 Hartwood Cir
- 4511 Plumwood Ct
- 4332 Fishcreek Rd
- 4321 Fishcreek Rd
- 4509 Plumwood Ct
- 2734 Hartwood Cir
- 4343 Fishcreek Rd
- 4517 Plumwood Ct
- 4501 Plumwood Ct
- 2743 Laurel Woods Blvd
- 2743 Hartwood Cir
- 4493 Plumwood Ct
- 2746 Saybrooke Blvd
- 2758 Saybrooke Blvd
- 2748 Hartwood Cir
- 4518 Plumwood Ct
- 4368 Fishcreek Rd
- 4185 Courtiff Cir
- 4191 Courtiff Cir
- 4504 Plumwood Ct