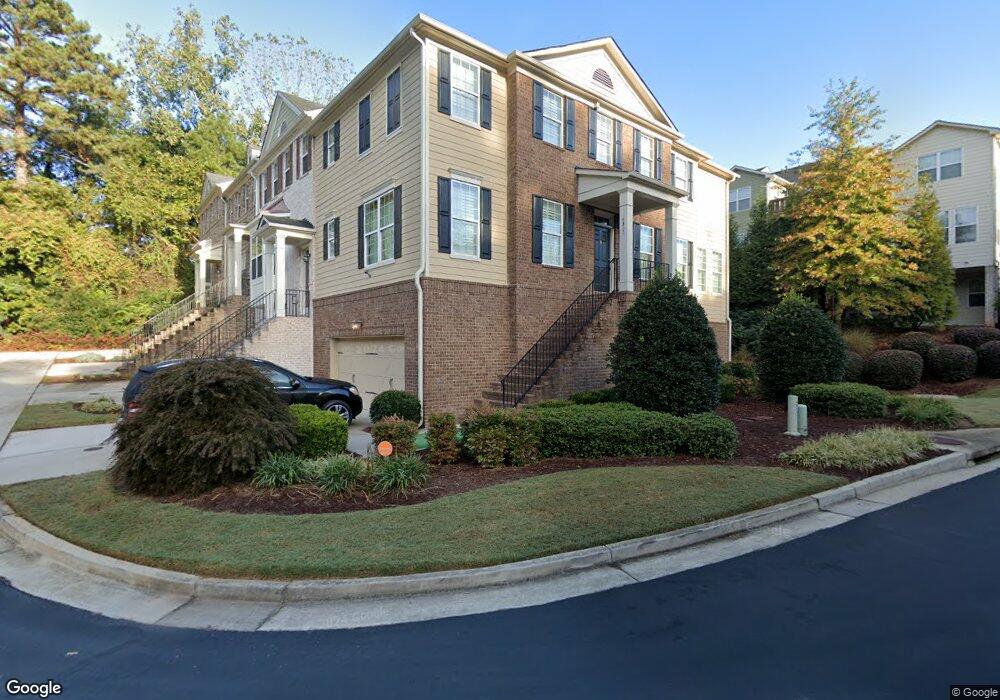
4306 Laurel Creek Ct SE Unit 7 Smyrna, GA 30080
Estimated Value: $419,000 - $431,094
3
Beds
4
Baths
2,678
Sq Ft
$159/Sq Ft
Est. Value
About This Home
This home is located at 4306 Laurel Creek Ct SE Unit 7, Smyrna, GA 30080 and is currently estimated at $426,524, approximately $159 per square foot. 4306 Laurel Creek Ct SE Unit 7 is a home located in Cobb County with nearby schools including Nickajack Elementary School, Campbell Middle School, and Campbell High School.
Ownership History
Date
Name
Owned For
Owner Type
Purchase Details
Closed on
Aug 21, 2025
Sold by
Vivekanandan Natarajan and Vivekanandan Rajeswari
Bought by
Annacchino Anthony P
Current Estimated Value
Purchase Details
Closed on
Apr 27, 2017
Sold by
Allen James B
Bought by
Vivekanandan Rajeswari and Vivekanandan Natarajan
Home Financials for this Owner
Home Financials are based on the most recent Mortgage that was taken out on this home.
Original Mortgage
$258,001
Interest Rate
4.14%
Mortgage Type
New Conventional
Purchase Details
Closed on
May 18, 2012
Sold by
Ashton Atlanta Residential
Bought by
Allen Carmen P and Allen James B
Home Financials for this Owner
Home Financials are based on the most recent Mortgage that was taken out on this home.
Original Mortgage
$154,900
Interest Rate
3.25%
Mortgage Type
New Conventional
Create a Home Valuation Report for This Property
The Home Valuation Report is an in-depth analysis detailing your home's value as well as a comparison with similar homes in the area
Home Values in the Area
Average Home Value in this Area
Purchase History
| Date | Buyer | Sale Price | Title Company |
|---|---|---|---|
| Annacchino Anthony P | $425,000 | None Listed On Document | |
| Annacchino Anthony P | $425,000 | None Listed On Document | |
| Vivekanandan Rajeswari | $334,000 | -- | |
| Allen Carmen P | $254,900 | -- |
Source: Public Records
Mortgage History
| Date | Status | Borrower | Loan Amount |
|---|---|---|---|
| Previous Owner | Vivekanandan Rajeswari | $258,001 | |
| Previous Owner | Allen Carmen P | $154,900 |
Source: Public Records
Tax History Compared to Growth
Tax History
| Year | Tax Paid | Tax Assessment Tax Assessment Total Assessment is a certain percentage of the fair market value that is determined by local assessors to be the total taxable value of land and additions on the property. | Land | Improvement |
|---|---|---|---|---|
| 2025 | $1,381 | $187,936 | $44,000 | $143,936 |
| 2024 | $1,347 | $175,144 | $32,000 | $143,144 |
| 2023 | $1,141 | $175,144 | $32,000 | $143,144 |
| 2022 | $1,228 | $135,388 | $32,000 | $103,388 |
| 2021 | $1,228 | $135,388 | $32,000 | $103,388 |
| 2020 | $1,228 | $135,388 | $32,000 | $103,388 |
| 2019 | $1,189 | $122,252 | $32,000 | $90,252 |
| 2018 | $1,189 | $122,252 | $32,000 | $90,252 |
| 2017 | $3,085 | $107,308 | $20,000 | $87,308 |
| 2016 | $3,085 | $107,308 | $20,000 | $87,308 |
| 2015 | $3,161 | $107,308 | $20,000 | $87,308 |
| 2014 | $2,845 | $95,756 | $0 | $0 |
Source: Public Records
Map
Nearby Homes
- 4289 Laurel Creek Ct SE Unit 10
- 4287 Cabretta Dr SE
- 4266 Cabretta Dr SE
- 4430 Wilkerson Manor Dr SE
- 4428 Wilkerson Manor Dr SE Unit 6
- 4343 Ivy Glen Ct SE
- 4392 Paces Point Cir SE
- 4201 Charleston Trail SE
- 2207 Iron Gate Dr SE
- 1910 Cooper Landing Dr SE
- 1914 Cooper Landing Dr SE
- 4368 Laurel Cir SE
- 1554 Cooper Lake Rd SE
- 0 Gaylor St Unit 10203409
- 0 Gaylor St Unit 7275195
- 4060 Laurel Ridge Trail SE
- 4350 Oakdale Vinings Cir SE
- 4314 Laurel Creek Ct SE Unit 431
- 4310 Laurel Creek Ct SE Unit 3
- 4310 Laurel Creek Ct SE
- 4314 Laurel Creek Ct SE
- 4310 Laurel Creek Ct SE Unit 4310
- 4314 Laurel Creek Ct SE Unit 4314
- 4302 Laurel Creek Ct SE Unit 4302
- 4302 Laurel Creek Ct SE
- 4332 Laurel Creek Ct SE Unit 1
- 4328 Laurel Creek Ct SE
- 4328 Laurel Creek Ct SE Unit 3
- 4332 Laurel Creek Ct SE Unit 2
- 4282 Laurel Creek Ct SE Unit 10
- 4274 Laurel Creek Ct SE Unit 12
- 4274 Laurel Creek Ct SE Unit 4
- 4278 Laurel Creek Ct SE
- 4278 Laurel Creek Ct SE Unit 11
- 4286 Laurel Creek Ct SE Unit 9
- 4270 Laurel Creek Ct SE Unit 13
- 4270 Laurel Creek Ct SE Unit 4