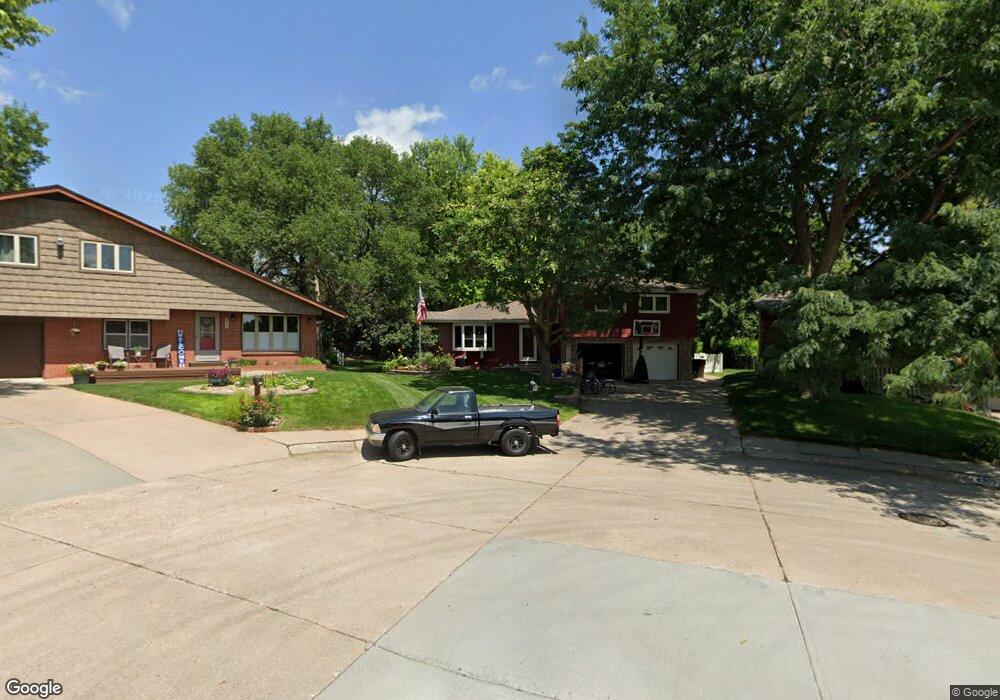
4307 Indian Rd Kearney, NE 68847
Estimated Value: $338,276 - $361,000
4
Beds
3
Baths
2,102
Sq Ft
$167/Sq Ft
Est. Value
About This Home
This home is located at 4307 Indian Rd, Kearney, NE 68847 and is currently estimated at $350,319, approximately $166 per square foot. 4307 Indian Rd is a home located in Buffalo County with nearby schools including Northeast Elementary School, Sunrise Middle School, and Kearney Senior High School.
Ownership History
Date
Name
Owned For
Owner Type
Purchase Details
Closed on
Jul 13, 2015
Sold by
Cruise Kyle R and Cruise Lindsay M
Bought by
Harvey Nicole J and Harvey Marcus A
Current Estimated Value
Home Financials for this Owner
Home Financials are based on the most recent Mortgage that was taken out on this home.
Original Mortgage
$218,695
Outstanding Balance
$172,118
Interest Rate
4.13%
Mortgage Type
New Conventional
Estimated Equity
$178,201
Purchase Details
Closed on
Feb 13, 2014
Sold by
Johnny J Johnny J and Schwartz Linda A
Bought by
Cruise Kyle R and Cruise Lindsay M
Create a Home Valuation Report for This Property
The Home Valuation Report is an in-depth analysis detailing your home's value as well as a comparison with similar homes in the area
Home Values in the Area
Average Home Value in this Area
Purchase History
| Date | Buyer | Sale Price | Title Company |
|---|---|---|---|
| Harvey Nicole J | $239,900 | Vintage Title | |
| Cruise Kyle R | $211,000 | Barney |
Source: Public Records
Mortgage History
| Date | Status | Borrower | Loan Amount |
|---|---|---|---|
| Open | Harvey Nicole J | $218,695 |
Source: Public Records
Tax History Compared to Growth
Tax History
| Year | Tax Paid | Tax Assessment Tax Assessment Total Assessment is a certain percentage of the fair market value that is determined by local assessors to be the total taxable value of land and additions on the property. | Land | Improvement |
|---|---|---|---|---|
| 2025 | $3,710 | $307,205 | $59,730 | $247,475 |
| 2024 | $3,710 | $281,235 | $57,990 | $223,245 |
| 2023 | $4,580 | $269,080 | $57,990 | $211,090 |
| 2022 | $4,182 | $238,280 | $53,500 | $184,780 |
| 2021 | $3,790 | $219,775 | $47,925 | $171,850 |
| 2020 | $3,753 | $217,000 | $45,150 | $171,850 |
| 2019 | $3,740 | $213,625 | $44,975 | $168,650 |
| 2018 | $3,685 | $213,485 | $36,600 | $176,885 |
| 2017 | $3,593 | $209,545 | $36,600 | $172,945 |
| 2016 | $3,563 | $209,545 | $36,600 | $172,945 |
| 2015 | $3,344 | $192,250 | $0 | $0 |
| 2014 | $2,828 | $148,355 | $0 | $0 |
Source: Public Records
Map
Nearby Homes