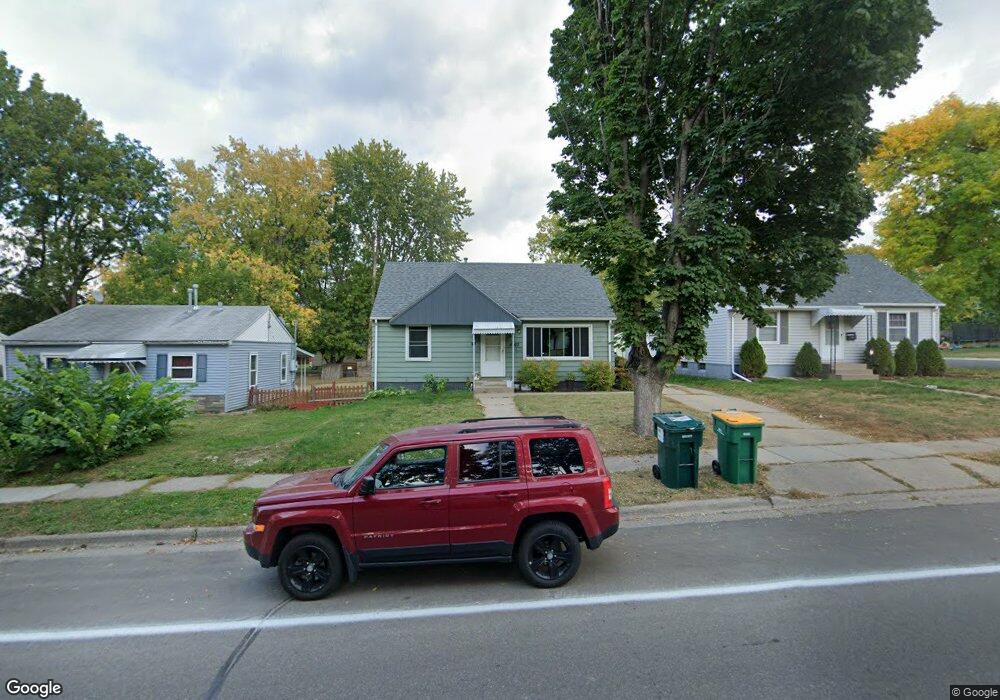
4307 Jefferson St NE Columbia Heights, MN 55421
Estimated Value: $271,000 - $288,000
3
Beds
1
Bath
1,499
Sq Ft
$187/Sq Ft
Est. Value
About This Home
This home is located at 4307 Jefferson St NE, Columbia Heights, MN 55421 and is currently estimated at $280,941, approximately $187 per square foot. 4307 Jefferson St NE is a home located in Anoka County with nearby schools including Valley View Elementary School, Prodeo Academy, and Immaculate Conception Catholic School.
Ownership History
Date
Name
Owned For
Owner Type
Purchase Details
Closed on
Nov 23, 2021
Sold by
Wilson Chad and Wilson Jamie
Bought by
Adrian Connor J
Current Estimated Value
Home Financials for this Owner
Home Financials are based on the most recent Mortgage that was taken out on this home.
Original Mortgage
$246,589
Outstanding Balance
$226,269
Interest Rate
3.09%
Mortgage Type
VA
Estimated Equity
$54,672
Purchase Details
Closed on
Feb 20, 2019
Sold by
Wilson Jamie and Wilson Chad
Bought by
Wilson Chad and Wilson Jamie
Home Financials for this Owner
Home Financials are based on the most recent Mortgage that was taken out on this home.
Original Mortgage
$186,913
Interest Rate
4.4%
Mortgage Type
VA
Purchase Details
Closed on
Feb 15, 2007
Sold by
Fredrickson Elden L and Fredrickson Theresa E
Bought by
Hagen Jamie and Hagen Wilson Chad
Home Financials for this Owner
Home Financials are based on the most recent Mortgage that was taken out on this home.
Original Mortgage
$164,900
Interest Rate
6.27%
Mortgage Type
New Conventional
Create a Home Valuation Report for This Property
The Home Valuation Report is an in-depth analysis detailing your home's value as well as a comparison with similar homes in the area
Home Values in the Area
Average Home Value in this Area
Purchase History
| Date | Buyer | Sale Price | Title Company |
|---|---|---|---|
| Adrian Connor J | $248,500 | Community Title & Escrow | |
| Wilson Chad | -- | None Available | |
| Hagen Jamie | $164,900 | -- |
Source: Public Records
Mortgage History
| Date | Status | Borrower | Loan Amount |
|---|---|---|---|
| Open | Adrian Connor J | $246,589 | |
| Previous Owner | Wilson Chad | $186,913 | |
| Previous Owner | Hagen Jamie | $164,900 |
Source: Public Records
Tax History Compared to Growth
Tax History
| Year | Tax Paid | Tax Assessment Tax Assessment Total Assessment is a certain percentage of the fair market value that is determined by local assessors to be the total taxable value of land and additions on the property. | Land | Improvement |
|---|---|---|---|---|
| 2025 | $4,999 | $245,500 | $92,000 | $153,500 |
| 2024 | $4,999 | $243,900 | $92,000 | $151,900 |
| 2023 | $3,871 | $251,100 | $89,200 | $161,900 |
| 2022 | $2,560 | $259,200 | $90,200 | $169,000 |
| 2021 | $2,463 | $202,300 | $65,700 | $136,600 |
| 2020 | $2,550 | $184,500 | $63,500 | $121,000 |
| 2019 | $2,173 | $198,700 | $62,000 | $136,700 |
| 2018 | $1,944 | $169,000 | $0 | $0 |
| 2017 | $1,766 | $147,600 | $0 | $0 |
| 2016 | $1,753 | $128,600 | $0 | $0 |
| 2015 | -- | $128,600 | $50,400 | $78,200 |
| 2014 | -- | $100,900 | $33,800 | $67,100 |
Source: Public Records
Map
Nearby Homes
- 4304 Jefferson St NE
- 4415 Madison St NE
- 4146 Monroe St NE
- 4129 7th St NE
- 4256 Jackson St NE
- 4228 5th St NE
- 4438 6th St NE
- 4316 4th St NE
- 4537 Washington St NE
- 4507 5th St NE
- 4559 Washington St NE
- 4024 Quincy St NE
- 4635 6th St NE
- 4685 Monroe St NE
- 4687 Monroe St NE
- 973 43rd Ave NE
- 4130 3rd St NE Unit 103
- 625 47th Ave NE
- 999 41st Ave NE Unit 311
- 999 41st Ave NE Unit 120NE
- 4311 Jefferson St NE
- 4315 Jefferson St NE
- 4323 Jefferson St NE
- 4310 Jefferson St NE
- 4300 Jefferson St NE
- 4257 Jefferson St NE
- 4314 Jefferson St NE
- 4300 Madison St NE
- 4306 Madison St NE
- 4312 Madison St NE
- 4327 Jefferson St NE
- 4318 Jefferson St NE
- 4320 Madison St NE
- 4262 Jefferson St NE
- 4262 4262 Jefferson-Street-ne
- 4251 Jefferson St NE
- 4329 Jefferson St NE
- 4322 Jefferson St NE
- 4256 Madison St NE
- 4256 Jefferson St NE