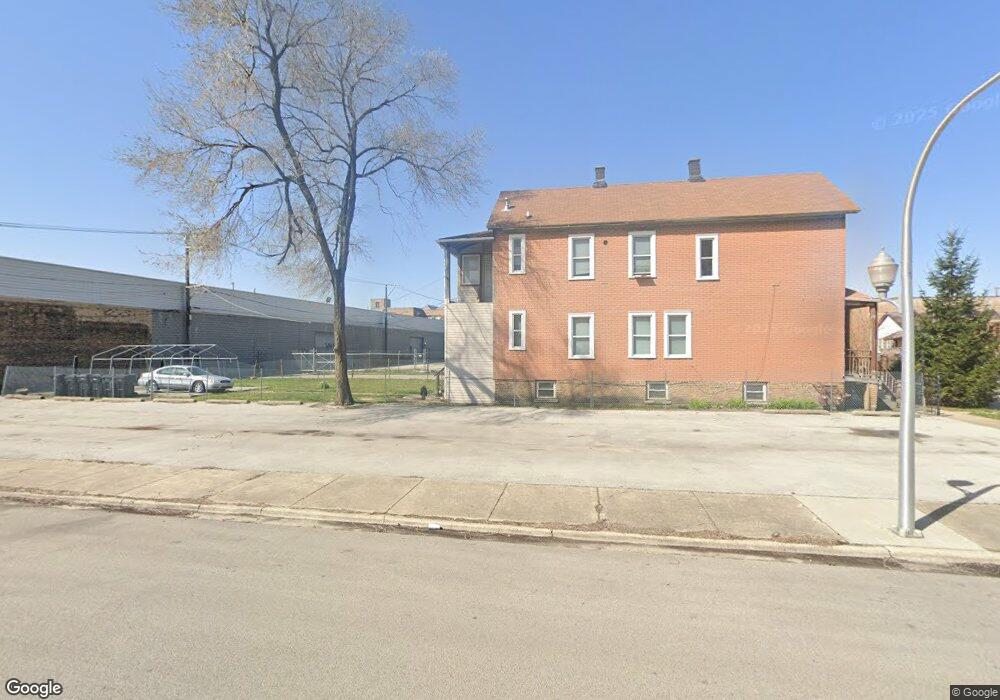
4307 W Carroll Ave Chicago, IL 60624
Garfield Park NeighborhoodEstimated Value: $309,000
4
Beds
2
Baths
1,800
Sq Ft
$172/Sq Ft
Est. Value
About This Home
This home is located at 4307 W Carroll Ave, Chicago, IL 60624 and is currently estimated at $309,000, approximately $171 per square foot. 4307 W Carroll Ave is a home located in Cook County with nearby schools including Tilton Elementary School, Marshall Metropolitan High School, and The Field School.
Ownership History
Date
Name
Owned For
Owner Type
Purchase Details
Closed on
Apr 22, 2009
Sold by
Us Bank National Association
Bought by
Lakkware Llc
Current Estimated Value
Purchase Details
Closed on
Jan 22, 2008
Sold by
Meeks Terry
Bought by
Us Bank Na and The Bnc Mortgage Loan Trust 2006-2
Purchase Details
Closed on
Aug 2, 2006
Sold by
Williams Robert
Bought by
Meeks Terry
Home Financials for this Owner
Home Financials are based on the most recent Mortgage that was taken out on this home.
Original Mortgage
$172,000
Interest Rate
6.88%
Mortgage Type
Unknown
Purchase Details
Closed on
Sep 25, 1997
Sold by
Donaldson Steven and Donaldson Ethel Mae
Bought by
Williams Robert
Home Financials for this Owner
Home Financials are based on the most recent Mortgage that was taken out on this home.
Original Mortgage
$17,500
Interest Rate
7.63%
Mortgage Type
Commercial
Create a Home Valuation Report for This Property
The Home Valuation Report is an in-depth analysis detailing your home's value as well as a comparison with similar homes in the area
Home Values in the Area
Average Home Value in this Area
Purchase History
| Date | Buyer | Sale Price | Title Company |
|---|---|---|---|
| Lakkware Llc | $10,000 | None Available | |
| Us Bank Na | -- | None Available | |
| Meeks Terry | $215,000 | Prairie Title | |
| Meeks Terry | $215,000 | Prairie Title | |
| Williams Robert | $16,666 | -- |
Source: Public Records
Mortgage History
| Date | Status | Borrower | Loan Amount |
|---|---|---|---|
| Previous Owner | Meeks Terry | $172,000 | |
| Previous Owner | Williams Robert | $17,500 |
Source: Public Records
Tax History Compared to Growth
Tax History
| Year | Tax Paid | Tax Assessment Tax Assessment Total Assessment is a certain percentage of the fair market value that is determined by local assessors to be the total taxable value of land and additions on the property. | Land | Improvement |
|---|---|---|---|---|
| 2024 | $796 | $4,000 | $4,000 | -- |
| 2023 | $773 | $3,760 | $3,760 | -- |
| 2022 | $773 | $3,760 | $3,760 | $0 |
| 2021 | $756 | $3,760 | $3,760 | $0 |
| 2020 | $838 | $3,760 | $3,760 | $0 |
| 2019 | $755 | $3,760 | $3,760 | $0 |
| 2018 | $743 | $3,760 | $3,760 | $0 |
| 2017 | $723 | $3,360 | $3,360 | $0 |
| 2016 | $673 | $3,360 | $3,360 | $0 |
| 2015 | $3,461 | $18,885 | $3,360 | $15,525 |
| 2014 | $2,946 | $15,880 | $3,200 | $12,680 |
| 2013 | $2,888 | $15,880 | $3,200 | $12,680 |
Source: Public Records
Map
Nearby Homes
- 4224 W Maypole Ave
- 257 N Kilbourn Ave
- 4432 W Maypole Ave
- 4407 W Maypole Ave
- 217 N Kostner Ave
- 4221 W Maypole Ave
- 4216 W West End Ave
- 4501 W Maypole Ave
- 223 N Kolmar Ave
- 4244 W Washington Blvd
- 3352 W Carroll Ave
- 4543 W West End Ave
- 4123 W Washington Blvd
- 3853 W Ferdinand St
- 4456 W Madison St
- 442 N Harding Ave
- 4153 W Madison St
- 4024 W Washington Blvd
- 4220 W Monroe St
- 445 N Harding Ave
- 4307 W Carroll Ave
- 4303 W Carroll Ave
- 4303 W Carroll Ave
- 4314 W Carroll Ave
- 4316 W Carroll Ave
- 4300 W Lake St
- 4258 W Carroll Ave
- 4258 W Carroll Ave
- 4258 W Lake St
- 4318 W Carroll Ave
- 4256 W Carroll Ave
- 4252 W Carroll Ave
- 4311 W Kinzie St
- 4313 W Kinzie St
- 4250 W Carroll Ave
- 4309 W Kinzie St
- 4243 W Carroll Ave Unit 1
- 4246 W Carroll Ave
- 4246 W Lake St
- 4241 W Carroll Ave