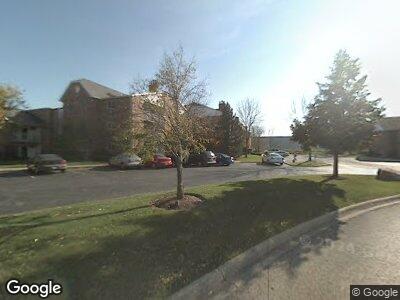
4307 W Shamrock Ln Unit 1D McHenry, IL 60050
Estimated Value: $143,900 - $172,000
2
Beds
1
Bath
875
Sq Ft
$179/Sq Ft
Est. Value
About This Home
This home is located at 4307 W Shamrock Ln Unit 1D, McHenry, IL 60050 and is currently estimated at $156,975, approximately $179 per square foot. 4307 W Shamrock Ln Unit 1D is a home located in McHenry County with nearby schools including Riverwood Elementary School, Parkland School, and McHenry Community High School - Upper Campus.
Ownership History
Date
Name
Owned For
Owner Type
Purchase Details
Closed on
Aug 5, 2005
Sold by
Martin Luann M
Bought by
Serpe Jessica L
Current Estimated Value
Home Financials for this Owner
Home Financials are based on the most recent Mortgage that was taken out on this home.
Original Mortgage
$114,945
Outstanding Balance
$62,447
Interest Rate
5.71%
Mortgage Type
Fannie Mae Freddie Mac
Estimated Equity
$94,528
Purchase Details
Closed on
Jun 28, 2001
Sold by
Piatek Anthony
Bought by
Martin Luann M
Home Financials for this Owner
Home Financials are based on the most recent Mortgage that was taken out on this home.
Original Mortgage
$69,000
Interest Rate
7.2%
Mortgage Type
Purchase Money Mortgage
Purchase Details
Closed on
Jul 19, 2000
Sold by
Hud
Bought by
Piatek Anthony
Home Financials for this Owner
Home Financials are based on the most recent Mortgage that was taken out on this home.
Original Mortgage
$48,800
Interest Rate
8.15%
Mortgage Type
Purchase Money Mortgage
Create a Home Valuation Report for This Property
The Home Valuation Report is an in-depth analysis detailing your home's value as well as a comparison with similar homes in the area
Home Values in the Area
Average Home Value in this Area
Purchase History
| Date | Buyer | Sale Price | Title Company |
|---|---|---|---|
| Serpe Jessica L | $118,500 | Ticor | |
| Martin Luann M | $89,000 | Lawyers Title Pick Up | |
| Piatek Anthony | $61,000 | Stewart Title Company |
Source: Public Records
Mortgage History
| Date | Status | Borrower | Loan Amount |
|---|---|---|---|
| Open | Serpe Jessica L | $114,945 | |
| Previous Owner | Martin Luann M | $75,200 | |
| Previous Owner | Martin Luann M | $69,000 | |
| Previous Owner | Piatek Anthony | $48,800 |
Source: Public Records
Tax History Compared to Growth
Tax History
| Year | Tax Paid | Tax Assessment Tax Assessment Total Assessment is a certain percentage of the fair market value that is determined by local assessors to be the total taxable value of land and additions on the property. | Land | Improvement |
|---|---|---|---|---|
| 2023 | $2,965 | $32,210 | $3,121 | $29,089 |
| 2022 | $2,706 | $28,548 | $2,766 | $25,782 |
| 2021 | $2,615 | $26,765 | $2,593 | $24,172 |
| 2020 | $2,599 | $25,962 | $2,515 | $23,447 |
| 2019 | $2,544 | $24,683 | $2,391 | $22,292 |
| 2018 | $1,938 | $16,939 | $1,941 | $14,998 |
| 2017 | $1,914 | $16,229 | $1,860 | $14,369 |
| 2016 | $1,895 | $15,485 | $1,775 | $13,710 |
| 2013 | -- | $23,856 | $1,689 | $22,167 |
Source: Public Records
Map
Nearby Homes
- 4400 W Shamrock Ln Unit 1A
- 4404 W Shamrock Ln Unit 2B
- Lots 48-53 Ridgeview Dr
- 0 Route 31 Rd Unit 10923359
- 702 S Il Route 31
- 3711 Biscayne Rd
- 3707 Geneva Place
- 1100 S Illinois Route 31
- 1510 S Illinois Route 31
- 950 Donnelly Place
- 418 Kresswood Dr Unit 2
- 4801 W Glenbrook Trail
- 3503 Vine St
- 0000 Veterans Pkwy
- 1701 Dundalk Ln
- 2253 Concord Dr Unit 31C720
- 1959 Concord Dr Unit 73
- 2002 S Illinois Route 31
- 3814 Doherty Ln
- 2025 Concord Dr Unit 111
- 4301 W Shamrock Ln
- 4307 W Shamrock Ln
- 4307 W Shamrock Ln
- 4305 W Shamrock Ln
- 4301 W Shamrock Ln
- 4301 W Shamrock Ln
- 4307 W Shamrock Ln
- 4307 W Shamrock Ln
- 4307 W Shamrock Ln
- 4305 W Shamrock Ln
- 4307 W Shamrock Ln
- 4301 W Shamrock Ln
- 4305 W Shamrock Ln
- 4305 W Shamrock Ln
- 4305 W Shamrock Ln Unit 2B
- 4301 W Shamrock Ln Unit 3B
- 4307 W Shamrock Ln Unit 1D
- 4301 W Shamrock Ln Unit 2D
- 4307 W Shamrock Ln
- 4305 W Shamrock Ln Unit 2A