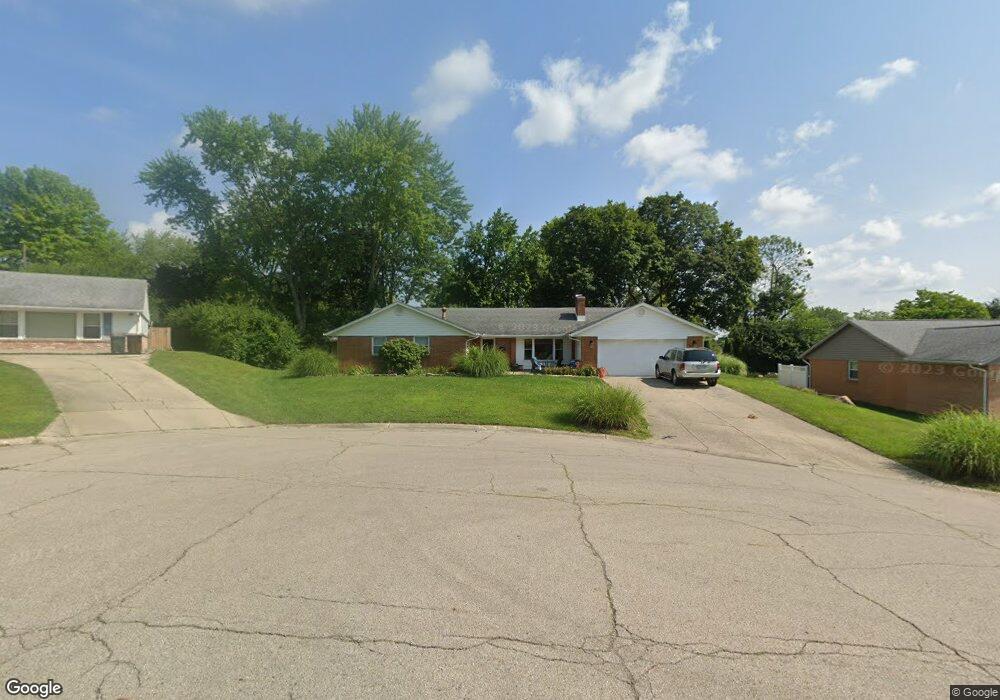
4308 Appleton Place Dayton, OH 45440
Estimated Value: $343,188 - $357,000
4
Beds
2
Baths
2,488
Sq Ft
$140/Sq Ft
Est. Value
About This Home
This home is located at 4308 Appleton Place, Dayton, OH 45440 and is currently estimated at $349,047, approximately $140 per square foot. 4308 Appleton Place is a home located in Montgomery County with nearby schools including Prass Elementary School, Kettering Middle School, and Kettering Fairmont High School.
Ownership History
Date
Name
Owned For
Owner Type
Purchase Details
Closed on
May 19, 2014
Sold by
Seaman Anita L
Bought by
Holley Brian M and Holley Ashley K
Current Estimated Value
Home Financials for this Owner
Home Financials are based on the most recent Mortgage that was taken out on this home.
Original Mortgage
$162,316
Outstanding Balance
$122,668
Interest Rate
4.34%
Mortgage Type
VA
Estimated Equity
$226,379
Purchase Details
Closed on
May 13, 2011
Sold by
Seaman Eric C
Bought by
Seaman Anita L
Purchase Details
Closed on
May 19, 2000
Sold by
Taylor Thomas G
Bought by
Seaman Eric C and Seaman Anita L
Home Financials for this Owner
Home Financials are based on the most recent Mortgage that was taken out on this home.
Original Mortgage
$118,300
Interest Rate
8.21%
Purchase Details
Closed on
May 10, 1996
Sold by
Wurst John C and Wurst Rose M
Bought by
Taylor Thomas G
Create a Home Valuation Report for This Property
The Home Valuation Report is an in-depth analysis detailing your home's value as well as a comparison with similar homes in the area
Home Values in the Area
Average Home Value in this Area
Purchase History
| Date | Buyer | Sale Price | Title Company |
|---|---|---|---|
| Holley Brian M | $158,900 | Msm Title Co | |
| Seaman Anita L | -- | Attorney | |
| Seaman Eric C | $147,900 | -- | |
| Taylor Thomas G | $137,900 | Lawyers Title Insurance Corp |
Source: Public Records
Mortgage History
| Date | Status | Borrower | Loan Amount |
|---|---|---|---|
| Open | Holley Brian M | $162,316 | |
| Previous Owner | Seaman Eric C | $118,300 |
Source: Public Records
Tax History
| Year | Tax Paid | Tax Assessment Tax Assessment Total Assessment is a certain percentage of the fair market value that is determined by local assessors to be the total taxable value of land and additions on the property. | Land | Improvement |
|---|---|---|---|---|
| 2025 | $6,222 | $97,630 | $13,130 | $84,500 |
| 2024 | $6,045 | $97,630 | $13,130 | $84,500 |
| 2023 | $6,045 | $97,630 | $13,130 | $84,500 |
| 2022 | $6,091 | $77,820 | $10,500 | $67,320 |
| 2021 | $5,632 | $77,820 | $10,500 | $67,320 |
| 2020 | $5,649 | $77,820 | $10,500 | $67,320 |
| 2019 | $5,195 | $63,260 | $10,500 | $52,760 |
| 2018 | $5,223 | $63,260 | $10,500 | $52,760 |
| 2017 | $4,810 | $63,260 | $10,500 | $52,760 |
| 2016 | $4,472 | $55,250 | $10,500 | $44,750 |
| 2015 | $4,272 | $55,250 | $10,500 | $44,750 |
| 2014 | $4,272 | $55,250 | $10,500 | $44,750 |
| 2012 | -- | $48,030 | $10,500 | $37,530 |
Source: Public Records
Map
Nearby Homes
- 4408 Glenheath Dr
- 2364 Hemphill Rd
- 2716 Hemphill Rd
- 4524 Drayton Ct
- 2222 Bending Willow Dr
- 2648 Parklawn Dr
- 2185 Bending Willow Dr
- 2816 Corlington Dr
- 4201 Green Springs Dr
- 2841 Corlington Dr
- 2951 Swigert Rd
- 2051 Hamlet Dr
- 4769 Bigger Rd
- 430 Craftsbury Ct
- 3170 E Stroop Rd Unit 209
- 3170 E Stroop Rd Unit 103
- 4485 Sentry Hill Ct
- 4820 Rean Meadow Dr
- 4484 Sentry Hill Ct
- 4426 Woodbank Dr
- 4316 Appleton Place
- 4300 Appleton Place
- 2414 Hemphill Rd
- 2422 Hemphill Rd
- 2406 Hemphill Rd
- 4301 Appleton Place
- 4324 Appleton Place
- 4317 Appleton Place
- 4309 Appleton Place
- 2398 Hemphill Rd
- 4210 Clarendon Dr
- 4325 Appleton Place
- 4220 Clarendon Dr
- 4200 Clarendon Dr
- 2438 Hemphill Rd
- 4332 Appleton Place
- 4333 Appleton Place
- 4230 Clarendon Dr
- 2423 Hemphill Rd
- 2415 Hemphill Rd
Your Personal Tour Guide
Ask me questions while you tour the home.