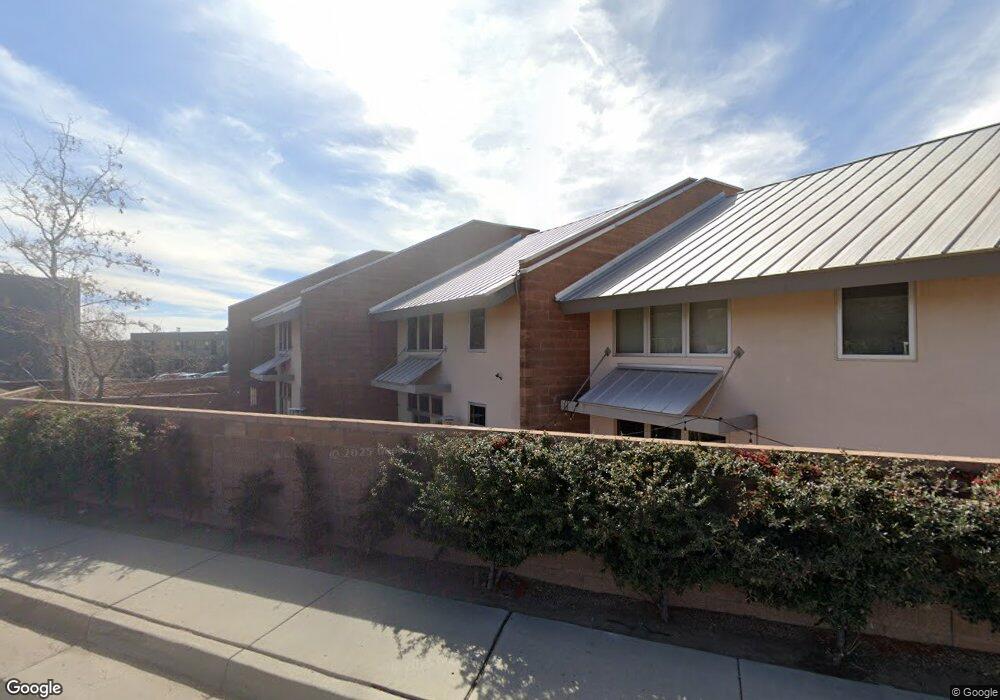
4308 Prairie Loft Way NE Albuquerque, NM 87111
The Heights NeighborhoodEstimated Value: $395,817 - $500,000
1
Bed
3
Baths
1,872
Sq Ft
$245/Sq Ft
Est. Value
About This Home
This home is located at 4308 Prairie Loft Way NE, Albuquerque, NM 87111 and is currently estimated at $459,204, approximately $245 per square foot. 4308 Prairie Loft Way NE is a home located in Bernalillo County with nearby schools including Eldorado High School, John Baker Elementary School, and Hoover Middle School.
Ownership History
Date
Name
Owned For
Owner Type
Purchase Details
Closed on
Dec 20, 2024
Sold by
Bushey Scott and De La Fuente
Bought by
Bushey De La Fuente Trust and Bushey
Current Estimated Value
Purchase Details
Closed on
Aug 23, 2022
Sold by
Scott Bushey
Bought by
Bushey Scott and Bushey La Fuente
Purchase Details
Closed on
Mar 29, 2012
Sold by
Frilling Elizabeth A
Bought by
Bushey Scott
Home Financials for this Owner
Home Financials are based on the most recent Mortgage that was taken out on this home.
Original Mortgage
$244,637
Interest Rate
3.75%
Mortgage Type
FHA
Purchase Details
Closed on
Jun 25, 2007
Sold by
Glenwood Lofts Llc
Bought by
Frilling Elizabeth A
Home Financials for this Owner
Home Financials are based on the most recent Mortgage that was taken out on this home.
Original Mortgage
$320,000
Interest Rate
6.19%
Mortgage Type
Purchase Money Mortgage
Create a Home Valuation Report for This Property
The Home Valuation Report is an in-depth analysis detailing your home's value as well as a comparison with similar homes in the area
Home Values in the Area
Average Home Value in this Area
Purchase History
| Date | Buyer | Sale Price | Title Company |
|---|---|---|---|
| Bushey De La Fuente Trust | -- | None Listed On Document | |
| Bushey Scott | -- | -- | |
| Bushey Scott | -- | Rio Grande Title Company Inc | |
| Frilling Elizabeth A | -- | First American Title Ins Co |
Source: Public Records
Mortgage History
| Date | Status | Borrower | Loan Amount |
|---|---|---|---|
| Previous Owner | Bushey Scott | $244,637 | |
| Previous Owner | Frilling Elizabeth A | $320,000 |
Source: Public Records
Tax History Compared to Growth
Tax History
| Year | Tax Paid | Tax Assessment Tax Assessment Total Assessment is a certain percentage of the fair market value that is determined by local assessors to be the total taxable value of land and additions on the property. | Land | Improvement |
|---|---|---|---|---|
| 2025 | $3,816 | $95,222 | $33,354 | $61,868 |
| 2024 | $3,816 | $92,449 | $32,383 | $60,066 |
| 2023 | $3,750 | $89,757 | $31,440 | $58,317 |
| 2022 | $3,621 | $87,142 | $30,524 | $56,618 |
| 2021 | $3,497 | $84,605 | $29,635 | $54,970 |
| 2020 | $3,543 | $84,605 | $29,635 | $54,970 |
| 2019 | $3,542 | $84,605 | $29,635 | $54,970 |
| 2018 | $3,519 | $84,605 | $29,635 | $54,970 |
| 2017 | $3,719 | $92,132 | $29,635 | $62,497 |
| 2016 | $3,610 | $86,845 | $27,935 | $58,910 |
| 2015 | $84,315 | $84,315 | $27,121 | $57,194 |
| 2014 | $3,476 | $81,859 | $26,331 | $55,528 |
| 2013 | -- | $79,475 | $25,564 | $53,911 |
Source: Public Records
Map
Nearby Homes
- 4335 Prairie Loft Way NE
- 4205 Landau St NE
- Patagonia Plan at Estates at Academy
- Cesena Plan at Estates at Academy
- 4015 Calle Pino NE
- 4509 Villa Loma Ln NE
- 4508 Shiloh Place NE
- 4441 Deborah Ln NE
- 13001 Glenwood Hills Ct NE
- 4413 Roxbury Ave NE
- 4013 Glen Canyon Ct NE
- 12701 Calle Cereza NE
- 3804 Mount Rainier Dr NE
- 4434 Sherre Dr NE
- 12701 Calle Cedro NE
- 3809 Calle Castano NE
- 12217 Vienna Dr NE
- 4713 Oahu Dr NE
- 3900 Embudito Dr NE
- 3604 Parisian Way NE
- 4304 Prairie Loft Way NE
- 4304 Prairie Loft Way NE Unit 3
- 4312 Prairie Loft Way NE
- 4323 Prairie Loft Way NE
- 4319 Prairie Loft Way NE
- 4305 Prairie Loft Way NE
- 4327 Prairie Loft Way NE
- 4331 Prairie Loft Way NE
- 4309 Prairie Loft Way NE
- 4301 Prairie Loft Way NE
- 4339 Prairie Loft Way NE
- 4405 Prairie Loft Way NE
- 4409 Prairie Loft Way NE
- 4409 Prairie Loft Way NE Unit 17
- 4200 Spanish Bit NE
- 4419 Prairie Loft Way NE
- 4423 Prairie Loft Way NE
- 0 Larchmont Dr NE
- 4427 Prairie Loft Way NE