4309 165th St Flushing, NY 11358
East Flushing NeighborhoodEstimated Value: $1,317,234 - $1,595,000
Studio
--
Bath
2,288
Sq Ft
$649/Sq Ft
Est. Value
About This Home
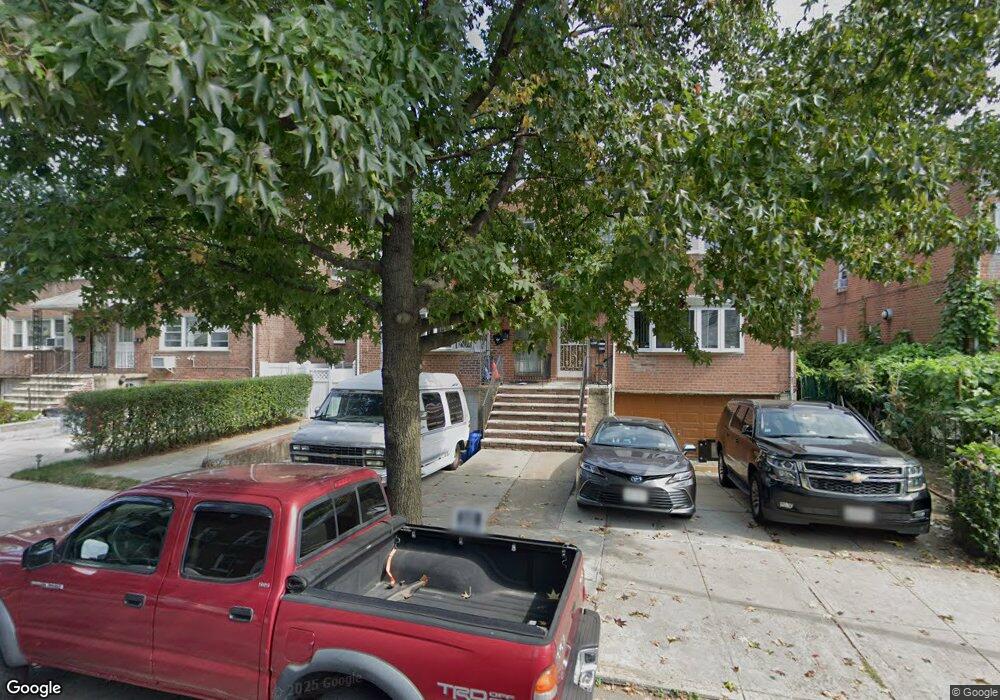
This home is located at 4309 165th St, Flushing, NY 11358 and is currently estimated at $1,485,559, approximately $649 per square foot. 4309 165th St is a home located in Queens County with nearby schools including P.S. 107 Thomas A Dooley, I.S. 25 Adrien Block, and Francis Lewis High School.
Ownership History
Date
Name
Owned For
Owner Type
Purchase Details
Closed on
Apr 13, 2022
Sold by
Lin Bao Man
Bought by
Lin Bao Man and Lin Jinhu
Current Estimated Value
Purchase Details
Closed on
Nov 17, 2017
Sold by
Li Qi Qin and Lin Bao Man
Bought by
Lin Bao Man
Purchase Details
Closed on
Nov 16, 2007
Sold by
Qu Yue Shuang and Zhang Ming Lei
Bought by
Li Qi Qin and Lin Bao Man
Home Financials for this Owner
Home Financials are based on the most recent Mortgage that was taken out on this home.
Original Mortgage
$450,000
Interest Rate
6.42%
Mortgage Type
Purchase Money Mortgage
Purchase Details
Closed on
Sep 7, 2000
Sold by
Li Linhui and Li Ling
Bought by
Zhang Ming Lei and Qu Yue Shuang
Home Financials for this Owner
Home Financials are based on the most recent Mortgage that was taken out on this home.
Original Mortgage
$220,000
Interest Rate
7.94%
Purchase Details
Closed on
Oct 27, 1995
Sold by
Dannenhoffer Claire E
Bought by
Li Linhui and Li Ling
Home Financials for this Owner
Home Financials are based on the most recent Mortgage that was taken out on this home.
Original Mortgage
$251,750
Interest Rate
7.47%
Create a Home Valuation Report for This Property
The Home Valuation Report is an in-depth analysis detailing your home's value as well as a comparison with similar homes in the area
Home Values in the Area
Average Home Value in this Area
Purchase History
| Date | Buyer | Sale Price | Title Company |
|---|---|---|---|
| Lin Bao Man | -- | -- | |
| Lin Bao Man | -- | -- | |
| Li Qi Qin | $880,000 | -- | |
| Zhang Ming Lei | $434,000 | Fidelity National Title Ins | |
| Li Linhui | $265,000 | -- |
Source: Public Records
Mortgage History
| Date | Status | Borrower | Loan Amount |
|---|---|---|---|
| Previous Owner | Li Qi Qin | $450,000 | |
| Previous Owner | Zhang Ming Lei | $220,000 | |
| Previous Owner | Li Linhui | $251,750 |
Source: Public Records
Tax History
| Year | Tax Paid | Tax Assessment Tax Assessment Total Assessment is a certain percentage of the fair market value that is determined by local assessors to be the total taxable value of land and additions on the property. | Land | Improvement |
|---|---|---|---|---|
| 2025 | $11,795 | $62,245 | $18,145 | $44,100 |
| 2024 | $11,795 | $58,723 | $18,691 | $40,032 |
| 2023 | $11,569 | $57,602 | $16,012 | $41,590 |
| 2022 | $10,848 | $89,580 | $23,700 | $65,880 |
| 2021 | $11,436 | $74,580 | $23,700 | $50,880 |
| 2020 | $10,980 | $81,120 | $23,700 | $57,420 |
| 2019 | $10,237 | $71,820 | $23,700 | $48,120 |
| 2018 | $9,785 | $48,002 | $19,669 | $28,333 |
| 2017 | $9,231 | $45,285 | $18,652 | $26,633 |
| 2016 | $9,053 | $45,285 | $18,652 | $26,633 |
| 2015 | $5,153 | $43,226 | $20,807 | $22,419 |
| 2014 | $5,153 | $40,780 | $21,086 | $19,694 |
Source: Public Records
Map
Nearby Homes
- 43-33 163rd St
- 4328 168th St
- 43-58 163rd St
- 167-22 Northern Blvd
- 43-27 162nd St
- 45-18 166th St
- 163-02 45th Ave
- 42-16 162nd St
- 4018 165th St
- 4012 166th St
- 45-25 168th St
- 4344 161st St
- 4363 160th St
- 45-74 164th St
- 36-40 167th St
- 16003 Sanford Ave
- 16001 Sanford Ave
- 4564 170th St
- 45-57 160th St
- 42-28 159th St
- 43-11 165th St Unit 2nd Fl
- 43-05 165th St
- 43-05 165th St Unit 2
- 43-05 165th St Unit 2nd Fl
- 4305 165th St
- 4311 165th St
- 43-09 165th St
- 43-09 165th St Unit 1Fl
- 4315 165th St
- 4303 165th St
- 43-15 165th St Unit 2Floor
- 43-15 165th St
- 4317 165th St
- 43-17 165th St Unit 2nd fl
- 43-17 165th St Unit 1st fl
- 4310 166th St
- 4306 166th St
- 4312 166th St
- 4302 166th St
- 43-19 165th St
Your Personal Tour Guide
Ask me questions while you tour the home.