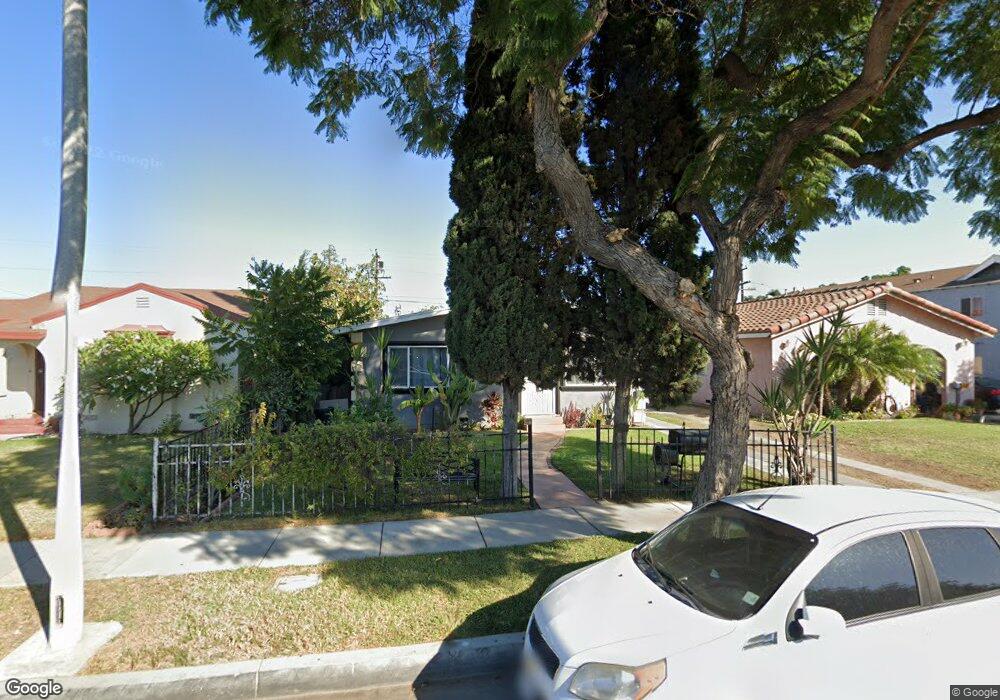
4309 E 53rd St Maywood, CA 90270
Estimated Value: $709,000 - $809,000
4
Beds
2
Baths
1,591
Sq Ft
$476/Sq Ft
Est. Value
About This Home
This home is located at 4309 E 53rd St, Maywood, CA 90270 and is currently estimated at $757,533, approximately $476 per square foot. 4309 E 53rd St is a home located in Los Angeles County with nearby schools including Maywood Elementary School, Chester W. Nimitz Middle School, and Maywood Academy High School.
Ownership History
Date
Name
Owned For
Owner Type
Purchase Details
Closed on
Jan 30, 2024
Sold by
Arreola Carlos
Bought by
Arreola Carlos
Current Estimated Value
Home Financials for this Owner
Home Financials are based on the most recent Mortgage that was taken out on this home.
Original Mortgage
$66,000
Outstanding Balance
$64,836
Interest Rate
6.62%
Mortgage Type
New Conventional
Estimated Equity
$692,697
Purchase Details
Closed on
Nov 5, 2003
Sold by
Arreola Blanca E
Bought by
Arreola Carlos
Purchase Details
Closed on
Jul 17, 2003
Sold by
Delopez Maria Cristina Montalvo
Bought by
Arreola Carlos
Purchase Details
Closed on
Aug 13, 2001
Sold by
Montalvo Maria Christina and Aguilar Grizelda
Bought by
Delopez Maria Cristina Montalvo
Create a Home Valuation Report for This Property
The Home Valuation Report is an in-depth analysis detailing your home's value as well as a comparison with similar homes in the area
Home Values in the Area
Average Home Value in this Area
Purchase History
| Date | Buyer | Sale Price | Title Company |
|---|---|---|---|
| Arreola Carlos | -- | Clearedge Title | |
| Arreola Carlos | -- | Lawyers Title | |
| Arreola Carlos | $285,000 | Lawyers Title | |
| Delopez Maria Cristina Montalvo | -- | -- | |
| Delopez Maria Cristina Montalvo | -- | -- |
Source: Public Records
Mortgage History
| Date | Status | Borrower | Loan Amount |
|---|---|---|---|
| Open | Arreola Carlos | $66,000 |
Source: Public Records
Tax History
| Year | Tax Paid | Tax Assessment Tax Assessment Total Assessment is a certain percentage of the fair market value that is determined by local assessors to be the total taxable value of land and additions on the property. | Land | Improvement |
|---|---|---|---|---|
| 2025 | $5,917 | $405,192 | $206,151 | $199,041 |
| 2024 | $5,917 | $397,248 | $202,109 | $195,139 |
| 2023 | $5,817 | $389,460 | $198,147 | $191,313 |
| 2022 | $6,927 | $381,824 | $194,262 | $187,562 |
| 2021 | $6,856 | $374,338 | $190,453 | $183,885 |
| 2020 | $6,889 | $370,501 | $188,501 | $182,000 |
| 2019 | $6,688 | $363,237 | $184,805 | $178,432 |
| 2018 | $6,536 | $356,116 | $181,182 | $174,934 |
| 2016 | $4,838 | $342,290 | $174,148 | $168,142 |
| 2015 | $4,558 | $337,150 | $171,533 | $165,617 |
| 2014 | $4,559 | $330,546 | $168,173 | $162,373 |
Source: Public Records
Map
Nearby Homes
- 4313 E 55th St
- 5202 Gifford Ave
- 5606 Pine Ave
- 4101 E 57th St
- 4539 E 53rd St
- 4212 E 58th St
- 3738 E 53rd St
- 3800 E 57th St
- 4301 E 60th St
- 3725 E 57th St
- 5115 Loma Vista Ave
- 6033 Clarkson Ave
- 6011 Bear Ave
- 5824 Heliotrope Ave
- 5716 Maywood Ave
- 3519 E 60th St
- 4026 Gage Ave
- 6122 Wilcox Ave
- 6152 Wilcox Ave
- 3633 Gage Ave
- 4313 E 53rd St
- 4307 E 53rd St
- 4301 E 53rd St
- 4319 E 53rd St
- 5212 Fishburn Ave
- 4321 E 53rd St
- 4310 E 52nd St
- 4314 E 52nd St
- 4318 E 52nd St
- 4327 E 53rd St
- 5225 Fishburn Ave
- 5215 Fishburn Ave
- 4308 E 53rd St
- 4322 E 52nd St
- 4304 E 53rd St
- 4312 E 53rd St
- 5213 Fishburn Ave
- 4300 E 53rd St
- 4316 E 53rd St
- 4331 E 53rd St