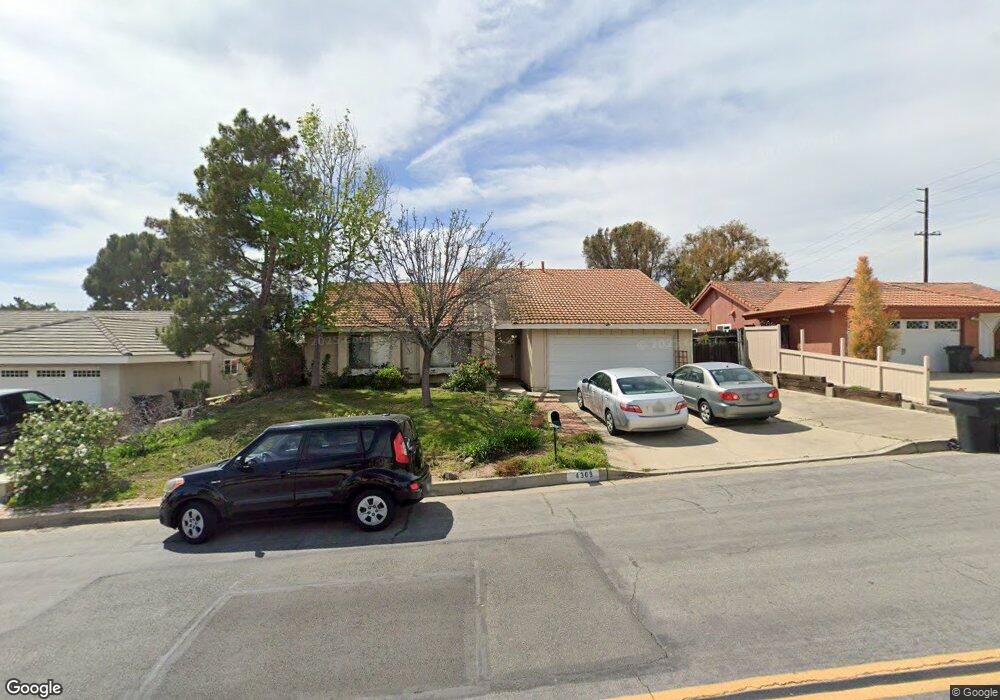
4309 Plumosa Dr Yorba Linda, CA 92886
Estimated Value: $1,253,000 - $1,482,000
4
Beds
2
Baths
1,864
Sq Ft
$732/Sq Ft
Est. Value
About This Home
This home is located at 4309 Plumosa Dr, Yorba Linda, CA 92886 and is currently estimated at $1,365,127, approximately $732 per square foot. 4309 Plumosa Dr is a home located in Orange County with nearby schools including Mabel M. Paine Elementary, Yorba Linda Middle School, and Yorba Linda High School.
Ownership History
Date
Name
Owned For
Owner Type
Purchase Details
Closed on
Mar 25, 2022
Sold by
Thornburg Scott C and Thornburg Lisa
Bought by
Thornburg Scott C
Current Estimated Value
Home Financials for this Owner
Home Financials are based on the most recent Mortgage that was taken out on this home.
Original Mortgage
$285,000
Outstanding Balance
$231,634
Interest Rate
3.63%
Mortgage Type
New Conventional
Estimated Equity
$1,133,493
Purchase Details
Closed on
Mar 12, 2012
Sold by
Thornburg Melissa K
Bought by
Thornburg Scott C
Purchase Details
Closed on
Sep 28, 2009
Sold by
Thornburg Scott C
Bought by
Thornburg Scott C and Thornburg Melissa K
Home Financials for this Owner
Home Financials are based on the most recent Mortgage that was taken out on this home.
Original Mortgage
$380,000
Interest Rate
5.05%
Mortgage Type
New Conventional
Purchase Details
Closed on
May 19, 2003
Sold by
Thornburg Scott C
Bought by
Thornburg Scott C and Thornburg Melissa K
Home Financials for this Owner
Home Financials are based on the most recent Mortgage that was taken out on this home.
Original Mortgage
$352,000
Interest Rate
5.77%
Mortgage Type
Purchase Money Mortgage
Purchase Details
Closed on
Apr 14, 2003
Sold by
Page J Russell and Page Kelly K
Bought by
Thornburg Scott C
Home Financials for this Owner
Home Financials are based on the most recent Mortgage that was taken out on this home.
Original Mortgage
$352,000
Interest Rate
5.77%
Mortgage Type
Purchase Money Mortgage
Purchase Details
Closed on
Apr 9, 1998
Sold by
Duy Bach Minh and Duy Anh Kim
Bought by
Page J Russell and Page Kelly K
Home Financials for this Owner
Home Financials are based on the most recent Mortgage that was taken out on this home.
Original Mortgage
$165,600
Interest Rate
7.06%
Create a Home Valuation Report for This Property
The Home Valuation Report is an in-depth analysis detailing your home's value as well as a comparison with similar homes in the area
Home Values in the Area
Average Home Value in this Area
Purchase History
| Date | Buyer | Sale Price | Title Company |
|---|---|---|---|
| Thornburg Scott C | -- | Wfg Title Insurance | |
| Thornburg Scott C | -- | None Available | |
| Thornburg Scott C | -- | Accommodation | |
| Thornburg Scott C | -- | North American Title Company | |
| Thornburg Scott C | -- | American Title Co | |
| Thornburg Scott C | -- | American Title Co | |
| Thornburg Scott C | $440,000 | American Title Co | |
| Page J Russell | $207,000 | Southland Title Corporation |
Source: Public Records
Mortgage History
| Date | Status | Borrower | Loan Amount |
|---|---|---|---|
| Open | Thornburg Scott C | $285,000 | |
| Previous Owner | Thornburg Scott C | $380,000 | |
| Previous Owner | Thornburg Scott C | $352,000 | |
| Previous Owner | Page J Russell | $165,600 | |
| Closed | Page J Russell | $31,050 | |
| Closed | Thornburg Scott C | $66,000 |
Source: Public Records
Tax History Compared to Growth
Tax History
| Year | Tax Paid | Tax Assessment Tax Assessment Total Assessment is a certain percentage of the fair market value that is determined by local assessors to be the total taxable value of land and additions on the property. | Land | Improvement |
|---|---|---|---|---|
| 2025 | $7,180 | $637,260 | $509,617 | $127,643 |
| 2024 | $7,180 | $624,765 | $499,624 | $125,141 |
| 2023 | $7,049 | $612,515 | $489,827 | $122,688 |
| 2022 | $6,978 | $600,505 | $480,222 | $120,283 |
| 2021 | $6,852 | $588,731 | $470,806 | $117,925 |
| 2020 | $6,755 | $582,695 | $465,979 | $116,716 |
| 2019 | $6,516 | $571,270 | $456,842 | $114,428 |
| 2018 | $6,434 | $560,069 | $447,884 | $112,185 |
| 2017 | $6,329 | $549,088 | $439,102 | $109,986 |
| 2016 | $6,201 | $538,322 | $430,492 | $107,830 |
| 2015 | $6,125 | $530,236 | $424,025 | $106,211 |
| 2014 | $5,943 | $519,850 | $415,719 | $104,131 |
Source: Public Records
Map
Nearby Homes
- 18141 Bastanchury Rd
- 4317 Canyon Coral Ln
- 4302 Eureka Ave
- 18118 Joel Brattain Dr
- 18534 Cobblestone Ct
- 18211 Joel Brattain Dr
- 18568 Arbor Gate Ln
- 18640 Seabiscuit Run
- 18665 Seabiscuit Run
- 4125 Temhurst Ct
- 3880 Hogan Dr
- 18701 Piper Place
- 18345 Watson Way
- 18742 Turfway Park
- 4845 Eisenhower Ct
- 4760 Lakeview Ave
- 4788 Lakeview Ave Unit 48
- 18751 Turfway Park
- 4891 Eureka Ave Unit 25
- 4241 Dorthea St
- 4315 Plumosa Dr
- 4303 Plumosa Dr
- 18178 Mollie Ln
- 4321 Plumosa Dr
- 18165 Mollie Ln
- 4311 Wild Ginger Cir
- 4305 Wild Ginger Cir
- 4307 Wild Ginger Cir
- 18168 Mollie Ln
- 4313 Wild Ginger Cir
- 4303 Wild Ginger Cir
- 18155 Mollie Ln
- 4301 Plumosa Dr
- 4319 Wild Ginger Cir
- 4304 Wild Ginger Cir
- 18158 Mollie Ln
- 4318 Wild Ginger Cir
- 4312 Wild Ginger Cir
- 4323 Wild Ginger Cir
- 4314 Wild Ginger Cir