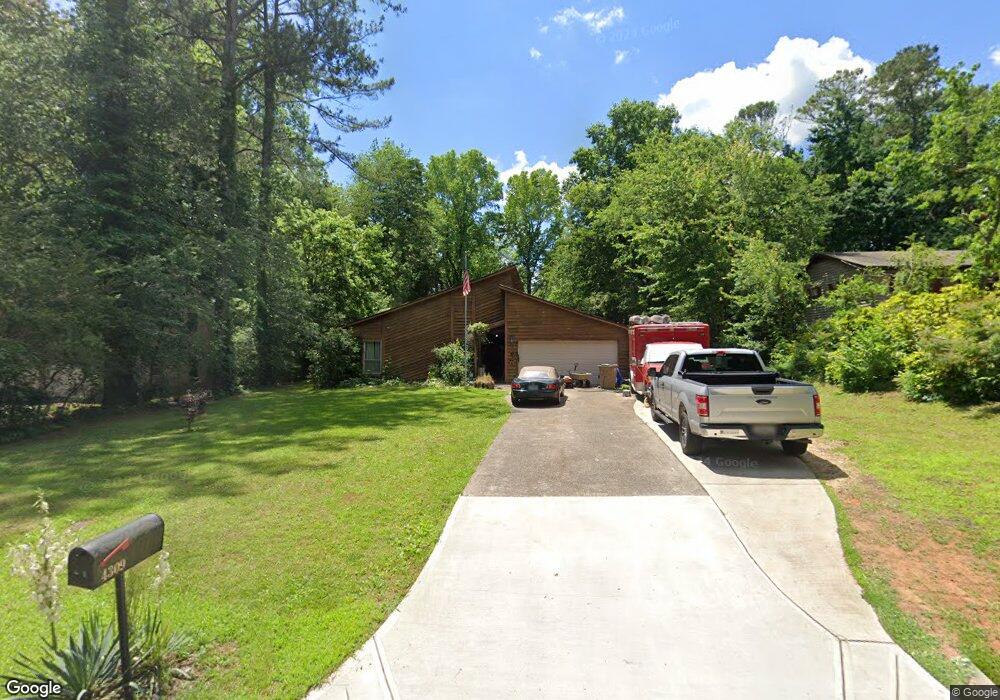
4309 Whitecap Rd Marietta, GA 30066
Sandy Plains NeighborhoodEstimated Value: $342,000 - $382,000
3
Beds
2
Baths
1,601
Sq Ft
$229/Sq Ft
Est. Value
About This Home
This home is located at 4309 Whitecap Rd, Marietta, GA 30066 and is currently estimated at $366,175, approximately $228 per square foot. 4309 Whitecap Rd is a home located in Cobb County with nearby schools including Nicholson Elementary School, McCleskey Middle School, and The Garden School.
Ownership History
Date
Name
Owned For
Owner Type
Purchase Details
Closed on
Mar 6, 2015
Sold by
Bertschy Amanda R
Bought by
Haenel William C
Current Estimated Value
Home Financials for this Owner
Home Financials are based on the most recent Mortgage that was taken out on this home.
Original Mortgage
$148,117
Outstanding Balance
$113,153
Interest Rate
3.69%
Mortgage Type
VA
Estimated Equity
$253,022
Purchase Details
Closed on
Oct 5, 2005
Sold by
Johnson Cathy A
Bought by
Bertschy Amanda R
Home Financials for this Owner
Home Financials are based on the most recent Mortgage that was taken out on this home.
Original Mortgage
$116,800
Interest Rate
5.72%
Mortgage Type
New Conventional
Purchase Details
Closed on
Sep 12, 2003
Sold by
Glenwood Oaks Partners Llp
Bought by
Hanna Fred
Purchase Details
Closed on
Feb 14, 2001
Sold by
Cattanach Glenn J
Bought by
Glenwood Oaks Partners Llp
Create a Home Valuation Report for This Property
The Home Valuation Report is an in-depth analysis detailing your home's value as well as a comparison with similar homes in the area
Home Values in the Area
Average Home Value in this Area
Purchase History
| Date | Buyer | Sale Price | Title Company |
|---|---|---|---|
| Haenel William C | $145,000 | -- | |
| Bertschy Amanda R | $146,000 | -- | |
| Hanna Fred | $126,500 | -- | |
| Glenwood Oaks Partners Llp | $115,000 | -- |
Source: Public Records
Mortgage History
| Date | Status | Borrower | Loan Amount |
|---|---|---|---|
| Open | Haenel William C | $148,117 | |
| Previous Owner | Bertschy Amanda R | $116,800 |
Source: Public Records
Tax History Compared to Growth
Tax History
| Year | Tax Paid | Tax Assessment Tax Assessment Total Assessment is a certain percentage of the fair market value that is determined by local assessors to be the total taxable value of land and additions on the property. | Land | Improvement |
|---|---|---|---|---|
| 2025 | $3,169 | $129,404 | $33,600 | $95,804 |
| 2024 | $3,171 | $129,404 | $33,600 | $95,804 |
| 2023 | $2,723 | $133,768 | $33,600 | $100,168 |
| 2022 | $2,283 | $87,744 | $24,000 | $63,744 |
| 2021 | $2,283 | $87,744 | $24,000 | $63,744 |
| 2020 | $2,008 | $75,172 | $19,200 | $55,972 |
| 2019 | $2,281 | $75,172 | $19,200 | $55,972 |
| 2018 | $2,041 | $67,240 | $19,200 | $48,040 |
| 2017 | $1,626 | $56,564 | $19,200 | $37,364 |
| 2016 | $1,626 | $56,564 | $19,200 | $37,364 |
| 2015 | $1,195 | $49,412 | $18,400 | $31,012 |
| 2014 | $1,206 | $49,412 | $0 | $0 |
Source: Public Records
Map
Nearby Homes
- 4262 Inlet Rd
- 4422 Inlet Rd
- 4413 Inlet Rd
- 1740 Latour Dr NE
- 4181 Keheley Dr NE
- 4281 Keheley Lake Dr NE
- 1718 Christie Dr NE
- 4314 Keheley Lake Ct NE
- 1528 Forest Trace
- 3980 Philmont Dr
- 4758 Jamerson Forest Cir
- 1634 Barrier Rd
- 1765 Blackwillow Dr
- 4680 Jamerson Forest Pkwy
- 1513 Jamerson Landing
- 1849 Service Dr NE
- 3796 Hickory Ridge Ct
- 3886 Ebenezer Rd
- 1192 Pathfinder Rd
- 4319 Whitecap Rd
- 4289 Whitecap Rd
- 4329 Whitecap Rd
- 4279 Whitecap Rd
- 4294 Reef Rd
- 4304 Reef Rd
- 4306 Whitecap Rd
- 4284 Reef Rd
- 4296 Whitecap Rd
- 4316 Whitecap Rd
- 4274 Reef Rd
- 4314 Reef Rd
- 4339 Whitecap Rd
- 4269 Whitecap Rd
- 0 Reef Rd Unit 7502375
- 0 Reef Rd Unit 7491739
- 0 Reef Rd Unit 7455167
- 0 Reef Rd Unit 8812755
- 4336 Whitecap Rd
- 4324 Reef Rd