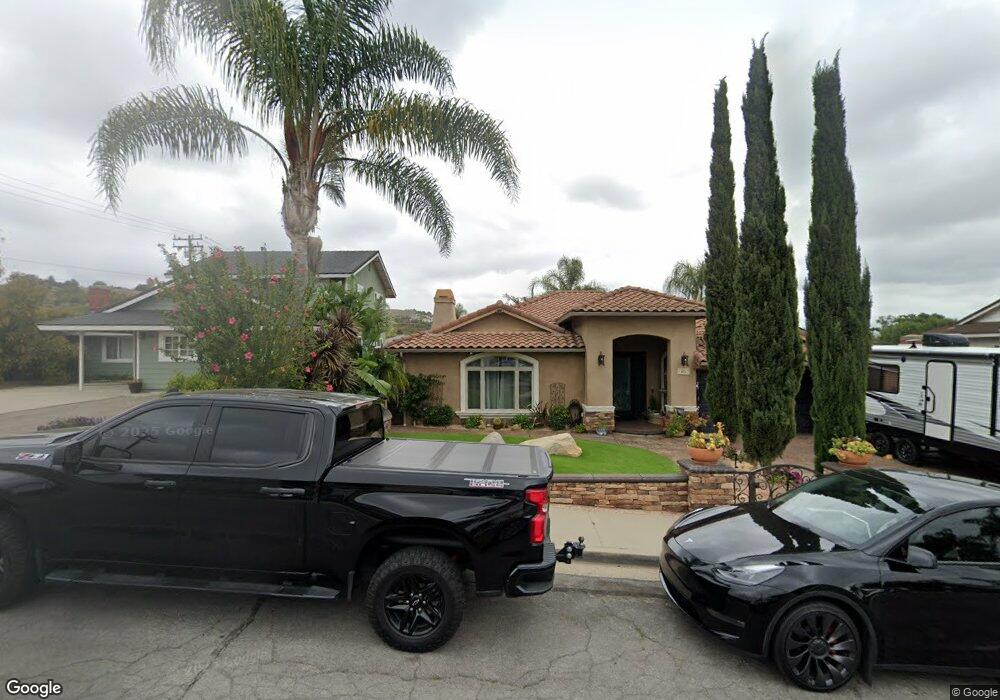
431 Atmore Dr Santa Paula, CA 93060
Estimated Value: $806,000 - $906,000
3
Beds
3
Baths
1,254
Sq Ft
$669/Sq Ft
Est. Value
About This Home
This home is located at 431 Atmore Dr, Santa Paula, CA 93060 and is currently estimated at $838,838, approximately $668 per square foot. 431 Atmore Dr is a home located in Ventura County with nearby schools including Glen City Elementary School, Isbell Middle, and Santa Paula High.
Ownership History
Date
Name
Owned For
Owner Type
Purchase Details
Closed on
Jan 12, 2021
Sold by
Ramirez Enrique Urrutia and Vega Ramirez Tanya
Bought by
Ramirez Enrique Urrutia and Vegaramirez Tanya C
Current Estimated Value
Purchase Details
Closed on
Jun 30, 2000
Sold by
Miller Christopher G and Miller Laura C
Bought by
Ramirez Enrique Urrutia and Vega Ramirez Tanya C
Home Financials for this Owner
Home Financials are based on the most recent Mortgage that was taken out on this home.
Original Mortgage
$211,750
Outstanding Balance
$75,610
Interest Rate
8.2%
Mortgage Type
Stand Alone First
Estimated Equity
$763,228
Purchase Details
Closed on
Sep 27, 1997
Sold by
Ruiz Thomas M and Ruiz Marsha A
Bought by
Miller Christopher G and Miller Laura C
Home Financials for this Owner
Home Financials are based on the most recent Mortgage that was taken out on this home.
Original Mortgage
$127,200
Interest Rate
7.49%
Create a Home Valuation Report for This Property
The Home Valuation Report is an in-depth analysis detailing your home's value as well as a comparison with similar homes in the area
Home Values in the Area
Average Home Value in this Area
Purchase History
| Date | Buyer | Sale Price | Title Company |
|---|---|---|---|
| Ramirez Enrique Urrutia | -- | None Available | |
| Ramirez Enrique Urrutia | $242,000 | Stewart Title | |
| Miller Christopher G | $159,000 | Old Republic Title Company |
Source: Public Records
Mortgage History
| Date | Status | Borrower | Loan Amount |
|---|---|---|---|
| Open | Ramirez Enrique Urrutia | $211,750 | |
| Previous Owner | Miller Christopher G | $127,200 |
Source: Public Records
Tax History Compared to Growth
Tax History
| Year | Tax Paid | Tax Assessment Tax Assessment Total Assessment is a certain percentage of the fair market value that is determined by local assessors to be the total taxable value of land and additions on the property. | Land | Improvement |
|---|---|---|---|---|
| 2025 | $4,910 | $434,663 | $145,844 | $288,819 |
| 2024 | $4,910 | $426,141 | $142,985 | $283,156 |
| 2023 | $4,807 | $417,786 | $140,182 | $277,604 |
| 2022 | $4,666 | $409,595 | $137,434 | $272,161 |
| 2021 | $4,651 | $401,564 | $134,739 | $266,825 |
| 2020 | $4,628 | $397,448 | $133,358 | $264,090 |
| 2019 | $4,374 | $389,656 | $130,744 | $258,912 |
| 2018 | $4,318 | $382,017 | $128,181 | $253,836 |
| 2017 | $4,367 | $374,527 | $125,668 | $248,859 |
| 2016 | $4,103 | $367,184 | $123,204 | $243,980 |
| 2015 | $3,854 | $355,470 | $121,354 | $234,116 |
| 2014 | $3,914 | $348,509 | $118,978 | $229,531 |
Source: Public Records
Map
Nearby Homes
- 423 Atmore Dr
- 428 Anacapa Terrace
- 545 W Santa Paula St
- 0 Dickenson Rd
- 525 W Santa Barbara St
- 362 W Santa Barbara St
- 324 W Santa Barbara St
- 535 Ridgecrest Dr
- 627 Center Ln
- 612 Shasta Dr
- 1848 Jojoba Dr
- 413 Checkerbloom Ln
- 1856 Jojoba Dr
- 1865 Jojoba Dr
- 455 Snowdrop Ln
- 457 Snowdrop Ln
- 605 Elfred Ct
- 100 E Virginia Terrace
- 747 Southwick St
- 421 N Palm Ave
- 439 Atmore Dr
- 415 Atmore Dr
- 445 Atmore Dr
- 299 W Santa Paula St
- 430 Atmore Dr
- 434 Atmore Dr
- 409 Atmore Dr
- 422 Atmore Dr
- 412 Atmore Dr
- 403 Atmore Dr
- 400 Atmore Dr
- 429 San Nicolas Ave
- 437 San Nicolas Ave
- 421 San Nicolas Ave
- 333 Atmore Dr
- 413 San Nicolas Ave
- 405 San Nicolas Ave
- 331 Atmore Dr
- 330 Atmore Dr
- 323 Atmore Dr