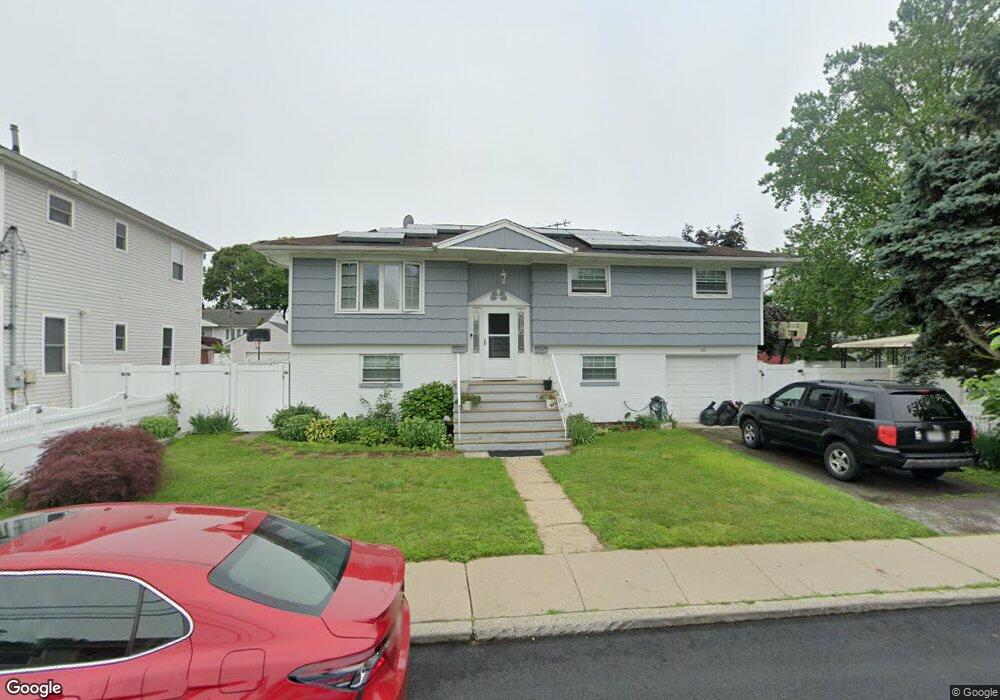
431 Champlain Ave West Hempstead, NY 11552
Estimated Value: $734,000 - $742,960
--
Bed
2
Baths
1,164
Sq Ft
$634/Sq Ft
Est. Value
About This Home
This home is located at 431 Champlain Ave, West Hempstead, NY 11552 and is currently estimated at $738,480, approximately $634 per square foot. 431 Champlain Ave is a home located in Nassau County with nearby schools including Davison Avenue Intermediate School, Maurice W. Downing Primary K-2 School, and Howard T Herber Middle School.
Ownership History
Date
Name
Owned For
Owner Type
Purchase Details
Closed on
May 17, 2020
Sold by
Billings Dornette and Billings Wanakee
Bought by
Billings Wanakee M and Cooper Meldalyn
Current Estimated Value
Purchase Details
Closed on
Jul 31, 2013
Sold by
Billings Dornette and Hostin Marcel
Bought by
Billings Dornette and Billings Wanakee
Home Financials for this Owner
Home Financials are based on the most recent Mortgage that was taken out on this home.
Original Mortgage
$358,694
Outstanding Balance
$266,854
Interest Rate
4.4%
Mortgage Type
FHA
Estimated Equity
$471,626
Purchase Details
Closed on
Dec 30, 2009
Sold by
Doves Cove Management
Bought by
Billings Dornette and Hostin Marcel
Home Financials for this Owner
Home Financials are based on the most recent Mortgage that was taken out on this home.
Original Mortgage
$353,479
Interest Rate
4.71%
Mortgage Type
FHA
Purchase Details
Closed on
Apr 16, 2009
Sold by
Hall Hugh R
Bought by
Doves Cove Management Inc
Create a Home Valuation Report for This Property
The Home Valuation Report is an in-depth analysis detailing your home's value as well as a comparison with similar homes in the area
Home Values in the Area
Average Home Value in this Area
Purchase History
| Date | Buyer | Sale Price | Title Company |
|---|---|---|---|
| Billings Wanakee M | -- | Judicial Title | |
| Billings Dornette | -- | -- | |
| Billings Dornette | $360,000 | -- | |
| Doves Cove Management Inc | $265,000 | -- | |
| Dove'S Cove Managment Inc | -- | -- |
Source: Public Records
Mortgage History
| Date | Status | Borrower | Loan Amount |
|---|---|---|---|
| Open | Billings Dornette | $358,694 | |
| Previous Owner | Billings Dornette | $353,479 |
Source: Public Records
Tax History Compared to Growth
Tax History
| Year | Tax Paid | Tax Assessment Tax Assessment Total Assessment is a certain percentage of the fair market value that is determined by local assessors to be the total taxable value of land and additions on the property. | Land | Improvement |
|---|---|---|---|---|
| 2025 | $14,550 | $487 | $170 | $317 |
| 2024 | $5,076 | $487 | $170 | $317 |
| 2023 | $15,073 | $487 | $170 | $317 |
| 2022 | $15,073 | $486 | $170 | $316 |
| 2021 | $21,249 | $459 | $160 | $299 |
| 2020 | $17,731 | $889 | $432 | $457 |
| 2019 | $5,751 | $889 | $432 | $457 |
| 2018 | $5,447 | $889 | $0 | $0 |
| 2017 | $9,933 | $889 | $432 | $457 |
| 2016 | $15,163 | $889 | $432 | $457 |
| 2015 | $4,893 | $889 | $432 | $457 |
| 2014 | $4,893 | $889 | $432 | $457 |
| 2013 | $4,608 | $889 | $432 | $457 |
Source: Public Records
Map
Nearby Homes
- 966 Woodfield Rd
- 1024 Mahopac Rd
- 394 Pinebrook Ave
- 10 Pinebrook Ave
- 1050 Mahopac Rd
- 486 Champlain Ave
- 7 Hopatcong Ave
- 461 Pinebrook Ave
- 5 Juliette Rd
- 538 Champlain Ave
- 1025 Ontario Rd
- 49 Carol St
- 841 Woodfield Rd
- 924 Otsego Ct
- 0 Rhodes Ln
- 450 Rhodes Ln
- 419 Coolidge Ave
- 55 Melvin Ave
- 362 Langdon Blvd
- 402 Clinton Ave
- 427 Champlain Ave
- 441 Champlain Ave
- 421 Champlain Ave
- 435 Bee Gee Ct
- 428 Champlain Ave
- 436 Champlain Ave
- 436 Champlain Ave
- 423 Bee Gee Ct
- 415 Champlain Ave
- 447 Champlain Ave
- 431 Bee Gee Ct
- 20 Champlain Ave
- 415 Bee Gee Ct
- 14 Mahopac Rd
- 14 Mahopac Rd
- 411 Champlain Ave
- 457 Champlain Ave
- 448 Champlain Ave
- 432 Canandaigua Ave
- 426 Canandaigua Ave