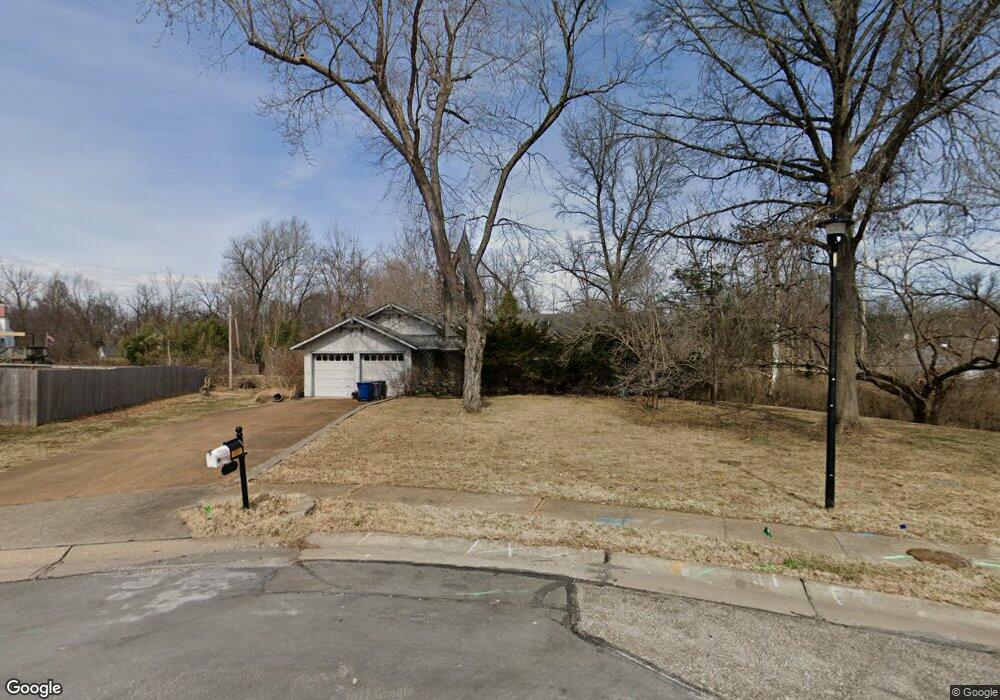
431 Covert Ct Ballwin, MO 63021
Estimated Value: $294,033 - $305,000
3
Beds
2
Baths
1,297
Sq Ft
$231/Sq Ft
Est. Value
About This Home
This home is located at 431 Covert Ct, Ballwin, MO 63021 and is currently estimated at $299,508, approximately $230 per square foot. 431 Covert Ct is a home located in St. Louis County with nearby schools including Ballwin Elementary School, Selvidge Middle School, and Marquette Sr. High School.
Ownership History
Date
Name
Owned For
Owner Type
Purchase Details
Closed on
Mar 24, 2005
Sold by
Hall Andrew R
Bought by
Klingensmith Roxann
Current Estimated Value
Home Financials for this Owner
Home Financials are based on the most recent Mortgage that was taken out on this home.
Original Mortgage
$169,110
Outstanding Balance
$86,075
Interest Rate
5.67%
Mortgage Type
Fannie Mae Freddie Mac
Estimated Equity
$213,433
Purchase Details
Closed on
Mar 31, 2003
Sold by
Schrader Deborah M
Bought by
Hall Andrew R
Home Financials for this Owner
Home Financials are based on the most recent Mortgage that was taken out on this home.
Original Mortgage
$159,000
Interest Rate
5.77%
Mortgage Type
Purchase Money Mortgage
Purchase Details
Closed on
Jan 2, 2002
Sold by
Schroder Deborah and Schrader Deborah M
Bought by
Schrader Deborah M
Home Financials for this Owner
Home Financials are based on the most recent Mortgage that was taken out on this home.
Original Mortgage
$57,950
Interest Rate
6.8%
Purchase Details
Closed on
Jul 30, 1999
Sold by
Keith Berger Brian and Keith Marie Nancy
Bought by
Schroder Deborah M
Home Financials for this Owner
Home Financials are based on the most recent Mortgage that was taken out on this home.
Original Mortgage
$98,000
Interest Rate
7.63%
Create a Home Valuation Report for This Property
The Home Valuation Report is an in-depth analysis detailing your home's value as well as a comparison with similar homes in the area
Home Values in the Area
Average Home Value in this Area
Purchase History
| Date | Buyer | Sale Price | Title Company |
|---|---|---|---|
| Klingensmith Roxann | $187,900 | Phoenix Title | |
| Hall Andrew R | $159,000 | -- | |
| Schrader Deborah M | -- | Nations Title Agency Inc | |
| Schroder Deborah M | $133,000 | -- |
Source: Public Records
Mortgage History
| Date | Status | Borrower | Loan Amount |
|---|---|---|---|
| Open | Klingensmith Roxann | $169,110 | |
| Previous Owner | Hall Andrew R | $159,000 | |
| Previous Owner | Schrader Deborah M | $57,950 | |
| Previous Owner | Schroder Deborah M | $98,000 |
Source: Public Records
Tax History
| Year | Tax Paid | Tax Assessment Tax Assessment Total Assessment is a certain percentage of the fair market value that is determined by local assessors to be the total taxable value of land and additions on the property. | Land | Improvement |
|---|---|---|---|---|
| 2025 | $3,373 | $56,390 | $24,450 | $31,940 |
| 2024 | $3,373 | $48,110 | $20,390 | $27,720 |
| 2023 | $3,371 | $48,110 | $20,390 | $27,720 |
| 2022 | $2,972 | $39,350 | $20,390 | $18,960 |
| 2021 | $2,950 | $39,350 | $20,390 | $18,960 |
| 2020 | $3,059 | $38,920 | $16,990 | $21,930 |
| 2019 | $3,071 | $38,920 | $16,990 | $21,930 |
| 2018 | $2,743 | $32,740 | $13,360 | $19,380 |
| 2016 | $2,417 | $28,390 | $9,480 | $18,910 |
Source: Public Records
Map
Nearby Homes
- 275 Essen Ct Unit TBB
- 247 Ramsey Ln
- 332 Remington Way Dr
- 429 Fairview Ct
- 112 Shirley Ln
- 521 Kehrs Mill Rd
- 533 Golfwood Dr
- 634 Parker Dr
- 318 Statewood Dr
- 548 Windsor Mill Dr
- 212 Lakeside Dr
- 107 Falmouth Dr
- 313 Saint Lawrence Dr
- 3 Chappel Ct
- 756 Alexander Mark Way
- 947 Bellestri Dr
- 312 Ballwin Ave
- 53 Log Hill Ln
- 127 Ivy Ct
- 401 Hillcrest Blvd
Your Personal Tour Guide
Ask me questions while you tour the home.