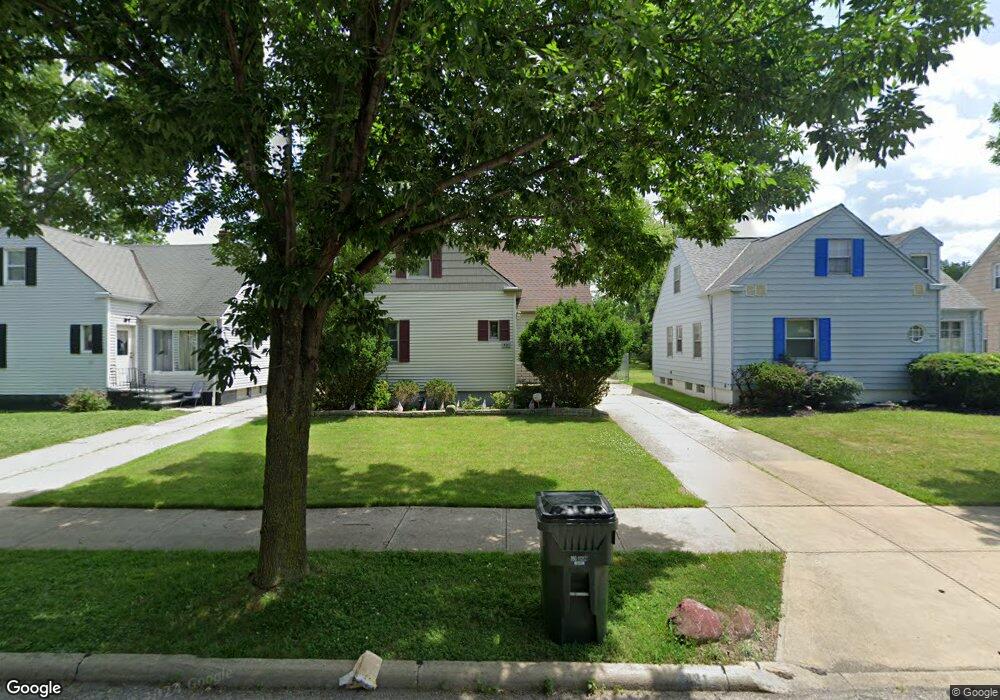
431 E 272nd St Euclid, OH 44132
Estimated Value: $139,779 - $167,000
4
Beds
1
Bath
1,522
Sq Ft
$102/Sq Ft
Est. Value
About This Home
This home is located at 431 E 272nd St, Euclid, OH 44132 and is currently estimated at $155,945, approximately $102 per square foot. 431 E 272nd St is a home located in Cuyahoga County with nearby schools including Shoreview Elementary School, Euclid High School, and Mater Dei Academy.
Ownership History
Date
Name
Owned For
Owner Type
Purchase Details
Closed on
Jan 16, 2017
Sold by
Scott James F and Scott Robet
Bought by
Scott James F
Current Estimated Value
Purchase Details
Closed on
Jan 9, 2017
Sold by
Scott James F
Bought by
Scott James F
Purchase Details
Closed on
Feb 17, 2006
Sold by
Scott John F
Bought by
Scott John F
Purchase Details
Closed on
Jul 6, 2001
Sold by
Scott John F and Scott Jean E
Bought by
Scott John F and Scott Jean E
Purchase Details
Closed on
Apr 2, 1985
Sold by
Scott John F and Scott Jean E
Bought by
Scott John F and Scott Jean E
Purchase Details
Closed on
Jan 1, 1975
Bought by
Scott John F and Scott Jean E
Create a Home Valuation Report for This Property
The Home Valuation Report is an in-depth analysis detailing your home's value as well as a comparison with similar homes in the area
Home Values in the Area
Average Home Value in this Area
Purchase History
| Date | Buyer | Sale Price | Title Company |
|---|---|---|---|
| Scott James F | -- | None Available | |
| Scott James F | -- | None Available | |
| Scott John F | -- | Attorney | |
| Scott John F | -- | -- | |
| Scott John F | -- | -- | |
| Scott John F | -- | -- |
Source: Public Records
Tax History
| Year | Tax Paid | Tax Assessment Tax Assessment Total Assessment is a certain percentage of the fair market value that is determined by local assessors to be the total taxable value of land and additions on the property. | Land | Improvement |
|---|---|---|---|---|
| 2025 | $2,796 | $41,720 | $9,170 | $32,550 |
| 2024 | $2,892 | $41,720 | $9,170 | $32,550 |
| 2023 | $2,178 | $33,780 | $6,930 | $26,850 |
| 2022 | $2,163 | $33,775 | $6,930 | $26,845 |
| 2021 | $2,402 | $33,780 | $6,930 | $26,850 |
| 2020 | $2,163 | $29,120 | $5,990 | $23,140 |
| 2019 | $1,943 | $83,200 | $17,100 | $66,100 |
| 2018 | $1,960 | $29,120 | $5,990 | $23,140 |
| 2017 | $2,965 | $25,760 | $4,970 | $20,790 |
| 2016 | $2,971 | $25,760 | $4,970 | $20,790 |
| 2015 | $2,738 | $25,760 | $4,970 | $20,790 |
| 2014 | $2,709 | $25,760 | $4,970 | $20,790 |
Source: Public Records
Map
Nearby Homes
- 406 E 274th St
- 427 E 275th St
- 411 E 270th St
- 440 E 271st St
- 298 E 270th St
- 625 Lloyd Rd
- 218 Wells Ct
- 257 E 270th St
- 325 E 264th St
- 295 E 276th St
- 591 Hemlock Dr
- 26931 Shoreview Ave
- 597 Hemlock Dr
- 26831 Shoreview Ave
- 27190 Zeman Ave
- 610 E 266th St
- 26530 Shoreview Ave
- 670 Hemlock Dr
- 25801 Lakeshore Blvd Unit 42
- 29616 Grand Blvd
Your Personal Tour Guide
Ask me questions while you tour the home.