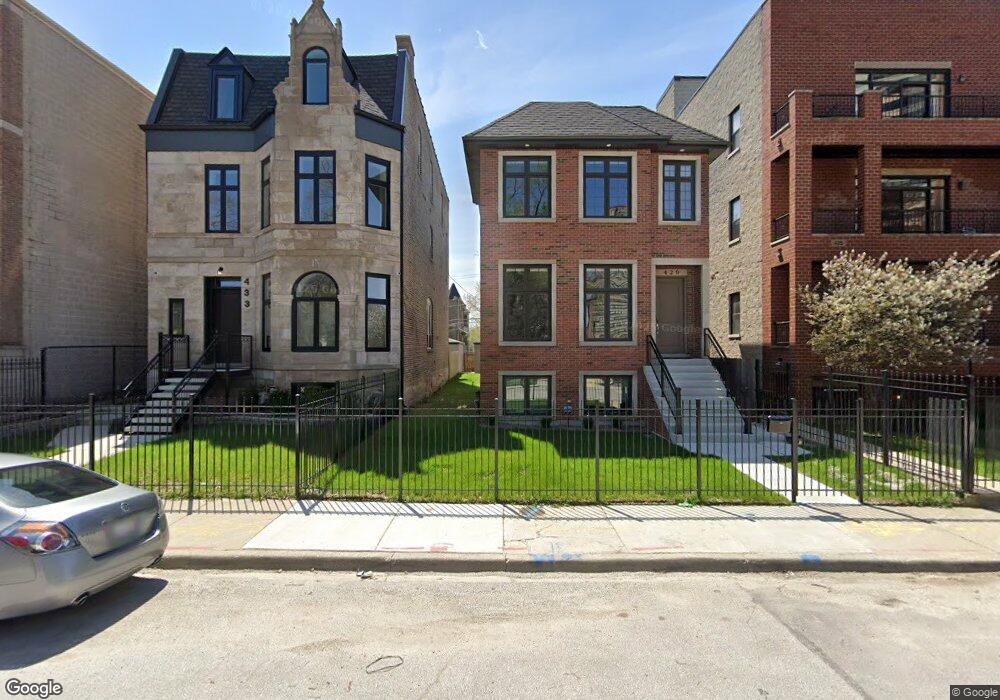
431 E 42nd St Chicago, IL 60653
Grand Boulevard NeighborhoodEstimated Value: $780,000 - $866,000
5
Beds
4
Baths
2,168
Sq Ft
$380/Sq Ft
Est. Value
About This Home
This home is located at 431 E 42nd St, Chicago, IL 60653 and is currently estimated at $824,166, approximately $380 per square foot. 431 E 42nd St is a home located in Cook County with nearby schools including Fuller Elementary School, UChicago Charter Carter G. Woodson Campus, and Holy Angels Catholic School.
Ownership History
Date
Name
Owned For
Owner Type
Purchase Details
Closed on
May 18, 2018
Sold by
Red Van Construction Inc
Bought by
Reynolds David J and Reynolds Stacy F
Current Estimated Value
Home Financials for this Owner
Home Financials are based on the most recent Mortgage that was taken out on this home.
Original Mortgage
$419,000
Outstanding Balance
$358,181
Interest Rate
4.37%
Mortgage Type
New Conventional
Estimated Equity
$465,985
Purchase Details
Closed on
Jan 30, 2017
Sold by
Grancer Ananias
Bought by
Red Van Construction Inc
Home Financials for this Owner
Home Financials are based on the most recent Mortgage that was taken out on this home.
Original Mortgage
$124,750
Interest Rate
3.75%
Mortgage Type
Commercial
Purchase Details
Closed on
May 3, 2001
Sold by
Harris Jesse V
Bought by
Granger Ananias
Purchase Details
Closed on
Apr 10, 1999
Sold by
Campbell Luther
Bought by
Harris Jesse V
Purchase Details
Closed on
Feb 20, 1999
Sold by
Thomas Henry
Bought by
Campbell Luther
Create a Home Valuation Report for This Property
The Home Valuation Report is an in-depth analysis detailing your home's value as well as a comparison with similar homes in the area
Home Values in the Area
Average Home Value in this Area
Purchase History
| Date | Buyer | Sale Price | Title Company |
|---|---|---|---|
| Reynolds David J | $649,000 | Chicago Title | |
| Red Van Construction Inc | -- | First American Title Insuran | |
| Granger Ananias | $30,000 | Chicago Title Insurance Co | |
| Harris Jesse V | -- | -- | |
| Campbell Luther | -- | -- |
Source: Public Records
Mortgage History
| Date | Status | Borrower | Loan Amount |
|---|---|---|---|
| Open | Reynolds David J | $419,000 | |
| Previous Owner | Red Van Construction Inc | $124,750 |
Source: Public Records
Tax History
| Year | Tax Paid | Tax Assessment Tax Assessment Total Assessment is a certain percentage of the fair market value that is determined by local assessors to be the total taxable value of land and additions on the property. | Land | Improvement |
|---|---|---|---|---|
| 2025 | $10,517 | $76,422 | $15,068 | $61,354 |
| 2024 | $10,517 | $76,422 | $15,068 | $61,354 |
| 2023 | $10,229 | $53,001 | $15,068 | $37,933 |
| 2022 | $10,229 | $53,001 | $15,068 | $37,933 |
| 2021 | $10,018 | $52,999 | $15,067 | $37,932 |
| 2020 | $10,149 | $48,659 | $7,318 | $41,341 |
| 2019 | $10,054 | $53,472 | $7,318 | $46,154 |
| 2018 | $1,446 | $7,318 | $7,318 | $0 |
| 2017 | $1,297 | $6,027 | $6,027 | $0 |
| 2016 | $1,207 | $6,027 | $6,027 | $0 |
| 2015 | $1,104 | $6,027 | $6,027 | $0 |
| 2014 | $959 | $5,166 | $5,166 | $0 |
| 2013 | $940 | $5,166 | $5,166 | $0 |
Source: Public Records
Map
Nearby Homes
- 4242 S Vincennes Ave Unit 2
- 421 E 43rd St
- 450 E Bowen Ave Unit 2W
- 4144 S King Dr Unit 11M
- 4148 S King Dr Unit G3
- 4235 S Calumet Ave
- 4208 S Calumet Ave Unit 101
- 4208 S Calumet Ave Unit 301
- 4208 S Calumet Ave Unit 201
- 4351 S Vincennes Ave Unit 2
- 4206 S Calumet Ave
- 543 E 43rd St Unit 3W
- 4343 S Forrestville Ave
- 346 E 41st St Unit 2
- 542 E 44th St Unit GARDEN
- 4244 S Prairie Ave
- 347 E 44th St
- 4055 S Calumet Ave Unit 3
- 633 E Bowen Ave Unit 1E
- 4443 S Vincennes Ave Unit 1
- 429 E 42nd St
- 433 E 42nd St
- 425 E 42nd St
- 425 E 42nd St Unit 1R
- 425 E 42nd St Unit 2
- 425 E 42nd St Unit 1
- 425 E 42nd St Unit C
- 425 E 42nd St Unit A
- 425 E 42nd St
- 425 E 42nd St Unit 3
- 425 E 42nd St Unit 1N
- 435 E 42nd St Unit 2
- 435 E 42nd St Unit 1
- 435 E 42nd St Unit 3
- 423 E 42nd St
- 437 E 42nd St
- 419 E 42nd St
- 441 E 42nd St
- 432 E 42nd Place
- 432 E 42nd Place
Your Personal Tour Guide
Ask me questions while you tour the home.