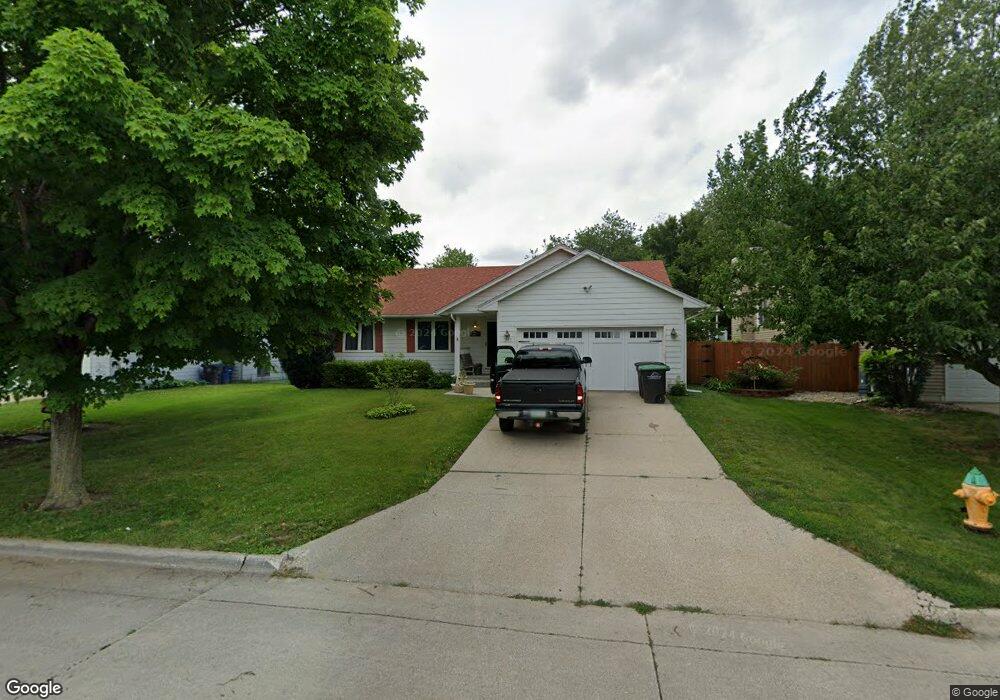
431 E Burnham Ave Des Moines, IA 50315
Estimated Value: $278,181 - $313,000
3
Beds
2
Baths
1,394
Sq Ft
$209/Sq Ft
Est. Value
About This Home
This home is located at 431 E Burnham Ave, Des Moines, IA 50315 and is currently estimated at $291,795, approximately $209 per square foot. 431 E Burnham Ave is a home located in Polk County with nearby schools including Morris Elementary School, Mccombs Middle School, and Lincoln High School.
Ownership History
Date
Name
Owned For
Owner Type
Purchase Details
Closed on
Apr 12, 2007
Sold by
Nesheim Julie Irene
Bought by
Mullenberg Gregory Rae and Mullenberg Julie Irene
Current Estimated Value
Home Financials for this Owner
Home Financials are based on the most recent Mortgage that was taken out on this home.
Original Mortgage
$128,000
Interest Rate
6.02%
Mortgage Type
Purchase Money Mortgage
Purchase Details
Closed on
Feb 23, 2007
Sold by
Fitzgerald Marilyn
Bought by
Nesheim Julie I
Home Financials for this Owner
Home Financials are based on the most recent Mortgage that was taken out on this home.
Original Mortgage
$128,000
Interest Rate
6.02%
Mortgage Type
Purchase Money Mortgage
Purchase Details
Closed on
Jul 13, 2001
Sold by
Keefe David L and Keefe Linda M
Bought by
Fitzgerald Marilyn
Purchase Details
Closed on
Apr 29, 1999
Sold by
Berkat Kim S
Bought by
Keefe David L and Keefe Linda M
Home Financials for this Owner
Home Financials are based on the most recent Mortgage that was taken out on this home.
Original Mortgage
$122,050
Interest Rate
7.05%
Create a Home Valuation Report for This Property
The Home Valuation Report is an in-depth analysis detailing your home's value as well as a comparison with similar homes in the area
Purchase History
| Date | Buyer | Sale Price | Title Company |
|---|---|---|---|
| Mullenberg Gregory Rae | -- | None Available | |
| Nesheim Julie I | $154,500 | Itc | |
| Fitzgerald Marilyn | $131,500 | -- | |
| Keefe David L | $128,000 | -- |
Source: Public Records
Mortgage History
| Date | Status | Borrower | Loan Amount |
|---|---|---|---|
| Closed | Nesheim Julie I | $128,000 | |
| Previous Owner | Keefe David L | $122,050 |
Source: Public Records
Tax History
| Year | Tax Paid | Tax Assessment Tax Assessment Total Assessment is a certain percentage of the fair market value that is determined by local assessors to be the total taxable value of land and additions on the property. | Land | Improvement |
|---|---|---|---|---|
| 2025 | $4,336 | $274,800 | $46,300 | $228,500 |
| 2024 | $4,336 | $239,500 | $39,800 | $199,700 |
| 2023 | $4,142 | $239,500 | $39,800 | $199,700 |
| 2022 | $4,108 | $188,000 | $32,300 | $155,700 |
| 2021 | $4,098 | $188,000 | $32,300 | $155,700 |
| 2020 | $4,250 | $176,100 | $30,200 | $145,900 |
| 2019 | $4,382 | $176,100 | $30,200 | $145,900 |
| 2018 | $4,330 | $174,800 | $28,700 | $146,100 |
| 2017 | $4,088 | $174,800 | $28,700 | $146,100 |
| 2016 | $3,976 | $162,900 | $26,300 | $136,600 |
| 2015 | $3,976 | $162,900 | $26,300 | $136,600 |
| 2014 | $3,698 | $151,200 | $24,200 | $127,000 |
Source: Public Records
Map
Nearby Homes
- 332 E Burnham Ave
- 7221 SE 5th St
- 6022 SE 4th St
- 7807 SE 2nd St
- 433 E Payton Ave
- 154 Crossroads Dr
- 7913 SE 1st Ct
- 413 E Wall Ave
- 6204 SW 5th St
- 01 County Line Rd
- 00 County Line Rd
- 7301 SE 14th St
- 5936 SW 2nd St
- 5600 SE 4th St
- 603 Lally St
- 439 E Porter Ave
- 817 E Diehl Ave
- 700 Payton Ave
- 5401 SE 6th St
- 5501 S Union St
- 427 E Burnham Ave
- 435 E Burnham Ave
- 6800 SE 4th Ct
- 436 E Burnham Ave
- 432 E Burnham Ave
- 440 E Burnham Ave
- 417 E Burnham Ave
- 428 E Burnham Ave
- 444 E Burnham Ave
- 6806 SE 4th Ct
- 424 E Burnham Ave
- 413 E Burnham Ave
- 405 E Burnham Ave
- 448 E Burnham Ave
- 420 E Burnham Ave
- 401 E Burnham Ave
- 6805 SE 4th Ct
- 6801 SE 4th Ct
- 6805 SE 4th St
- 452 E Burnham Ave
Your Personal Tour Guide
Ask me questions while you tour the home.