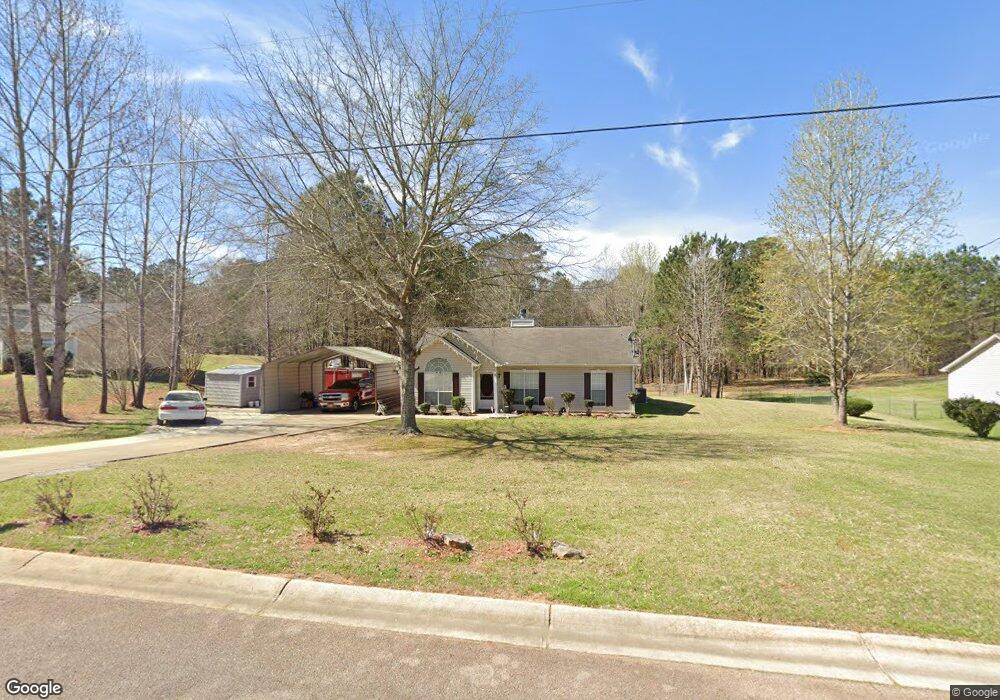
431 Hampton Green Dr Lagrange, GA 30240
Estimated Value: $238,110 - $266,000
3
Beds
2
Baths
1,497
Sq Ft
$166/Sq Ft
Est. Value
About This Home
This home is located at 431 Hampton Green Dr, Lagrange, GA 30240 and is currently estimated at $249,028, approximately $166 per square foot. 431 Hampton Green Dr is a home located in Troup County with nearby schools including Hillcrest Elementary School, Franklin Forest Elementary School, and Hollis Hand Elementary School.
Ownership History
Date
Name
Owned For
Owner Type
Purchase Details
Closed on
Sep 21, 2020
Sold by
Mcdonald Rachel E
Bought by
Jackson Chanua and Render Jacqueline
Current Estimated Value
Home Financials for this Owner
Home Financials are based on the most recent Mortgage that was taken out on this home.
Original Mortgage
$132,554
Outstanding Balance
$116,829
Interest Rate
2.9%
Mortgage Type
FHA
Estimated Equity
$132,199
Purchase Details
Closed on
Oct 28, 2004
Sold by
Jp Morgan Chase Bank
Bought by
Mcdonald Ryan T
Purchase Details
Closed on
Jul 6, 2004
Sold by
Kellie J Pate
Bought by
Jp Morgan Chase Bank
Purchase Details
Closed on
Jul 31, 2003
Sold by
Dri Hampton Green Llc
Bought by
Kellie J Pate
Purchase Details
Closed on
Jan 20, 1999
Sold by
Dan-Ric Inc
Bought by
Dri Hampton Green Llc
Purchase Details
Closed on
Jun 25, 1997
Bought by
Dan-Ric Inc
Create a Home Valuation Report for This Property
The Home Valuation Report is an in-depth analysis detailing your home's value as well as a comparison with similar homes in the area
Purchase History
| Date | Buyer | Sale Price | Title Company |
|---|---|---|---|
| Jackson Chanua | $135,000 | -- | |
| Mcdonald Ryan T | $87,500 | -- | |
| Jp Morgan Chase Bank | $74,000 | -- | |
| Kellie J Pate | $94,200 | -- | |
| Dri Hampton Green Llc | -- | -- | |
| Dan-Ric Inc | -- | -- |
Source: Public Records
Mortgage History
| Date | Status | Borrower | Loan Amount |
|---|---|---|---|
| Open | Jackson Chanua | $132,554 |
Source: Public Records
Tax History
| Year | Tax Paid | Tax Assessment Tax Assessment Total Assessment is a certain percentage of the fair market value that is determined by local assessors to be the total taxable value of land and additions on the property. | Land | Improvement |
|---|---|---|---|---|
| 2025 | $1,837 | $82,452 | $10,000 | $72,452 |
| 2024 | $1,837 | $69,344 | $10,000 | $59,344 |
| 2023 | $1,845 | $69,632 | $10,000 | $59,632 |
| 2022 | $1,748 | $64,632 | $10,000 | $54,632 |
| 2021 | $1,569 | $54,412 | $10,000 | $44,412 |
| 2020 | $1,473 | $48,852 | $8,000 | $40,852 |
| 2019 | $1,304 | $43,220 | $6,000 | $37,220 |
| 2018 | $1,303 | $43,220 | $6,000 | $37,220 |
| 2017 | $1,244 | $43,220 | $6,000 | $37,220 |
| 2016 | $959 | $33,774 | $4,800 | $28,974 |
| 2015 | $961 | $33,774 | $4,800 | $28,974 |
| 2014 | $881 | $31,093 | $4,800 | $26,293 |
| 2013 | -- | $32,539 | $4,800 | $27,739 |
Source: Public Records
Map
Nearby Homes
- 143 Taylor Len Dr
- 114 Taylor Len Dr
- 160 Lakemont Dr
- 178 Waterview Dr
- 113 Wellington Dr
- 24 N Brooks Rd
- 111 Copper Creek Dr
- 0 Waterview Dr Unit 10558462
- 1006 Wares Cross Rd
- 135 Copper Creek Dr
- 64 Waterview Ct
- 219 E Yorktown Dr
- 4555 Mooty Bridge Rd
- 11.62+/- AC New Franklin Rd
- 42 Wooding Place
- 206 Sturbridge Dr
- 106 Jandale Dr
- 207 N View Pointe Dr
- 0 River Club Dr Unit 10311961
- 183 Indian Bend Dr
- 433 Hampton Green Dr
- 429 Hampton Green Dr
- 432 Hampton Green Dr
- 434 Hampton Green Dr
- 435 Hampton Green Dr
- 435 Hampton Green Dr Unit 28
- 427 Hampton Green Dr
- 427 Hampton Green Dr
- 430 Hampton Green Dr
- 436 Hampton Green Dr
- 438 Hampton Green Dr
- 428 Hampton Green Dr
- 437 Hampton Green Dr
- 425 Hampton Green Dr
- 440 Hampton Green Dr
- 426 Hampton Green Dr
- 443 Hampton Green Dr
- 439 Hampton Green Dr
- 423 Hampton Green Dr
- 442 Hampton Green Dr
Your Personal Tour Guide
Ask me questions while you tour the home.