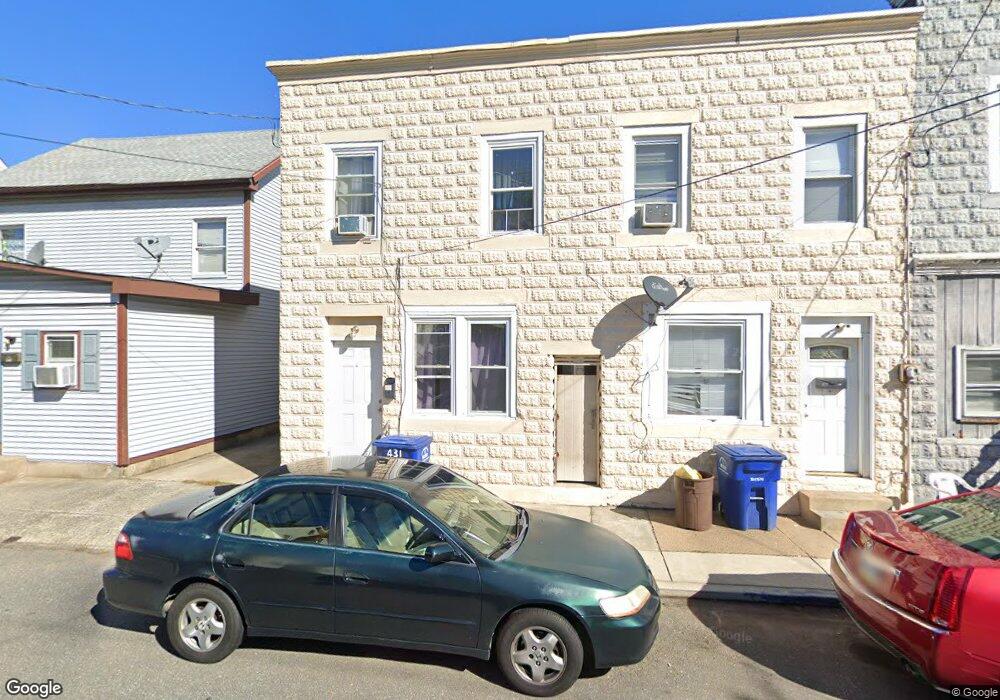
431 Kossuth St Riverside, NJ 08075
Riverside Township NeighborhoodEstimated Value: $156,000 - $259,000
3
Beds
1
Bath
1,650
Sq Ft
$133/Sq Ft
Est. Value
About This Home
This home is located at 431 Kossuth St, Riverside, NJ 08075 and is currently estimated at $219,050, approximately $132 per square foot. 431 Kossuth St is a home located in Burlington County with nearby schools including Riverside Elementary School, Riverside Middle School, and Riverside High School.
Ownership History
Date
Name
Owned For
Owner Type
Purchase Details
Closed on
Jun 9, 2010
Sold by
U S Bank National Association
Bought by
Lee Ping Yeung
Current Estimated Value
Purchase Details
Closed on
Jan 19, 2010
Sold by
Bowen John
Bought by
Us Bank National Association
Purchase Details
Closed on
Nov 15, 1995
Sold by
Sewall Curt N and Sewall Arleen M
Bought by
Bowen John
Create a Home Valuation Report for This Property
The Home Valuation Report is an in-depth analysis detailing your home's value as well as a comparison with similar homes in the area
Home Values in the Area
Average Home Value in this Area
Purchase History
| Date | Buyer | Sale Price | Title Company |
|---|---|---|---|
| Lee Ping Yeung | $34,900 | Land Title Services Nj Inc | |
| Us Bank National Association | -- | Land Title Services Nj Inc | |
| Bowen John | $53,042 | United Title & Abstract Agen |
Source: Public Records
Tax History Compared to Growth
Tax History
| Year | Tax Paid | Tax Assessment Tax Assessment Total Assessment is a certain percentage of the fair market value that is determined by local assessors to be the total taxable value of land and additions on the property. | Land | Improvement |
|---|---|---|---|---|
| 2025 | $3,944 | $96,100 | $33,800 | $62,300 |
| 2024 | $3,843 | $96,100 | $33,800 | $62,300 |
| 2023 | $3,843 | $96,100 | $33,800 | $62,300 |
| 2022 | $3,763 | $96,100 | $33,800 | $62,300 |
| 2021 | $3,723 | $96,100 | $33,800 | $62,300 |
| 2020 | $3,658 | $96,100 | $33,800 | $62,300 |
| 2019 | $3,602 | $96,100 | $33,800 | $62,300 |
| 2018 | $3,285 | $88,200 | $18,400 | $69,800 |
| 2017 | $3,197 | $88,200 | $18,400 | $69,800 |
| 2016 | $3,078 | $88,200 | $18,400 | $69,800 |
| 2015 | $3,019 | $88,200 | $18,400 | $69,800 |
| 2014 | $2,885 | $88,200 | $18,400 | $69,800 |
Source: Public Records
Map
Nearby Homes
- 506 Bridgeboro St
- 514 Bridgeboro St
- 334 Kossuth St
- 224 E Washington St
- 229 Filmore St
- 649 Bridgeboro St
- 304 Clay St
- 327 Whittaker St
- 224 Progress St
- 14 Grant St
- 528 S Fairview St
- 423 Delaware Ave
- 705 Arndt Ave
- 0 Delaware Ave Unit NJBL2090486
- 910 S Fairview St
- 212 Madison St
- 300-302 Madison St
- 580 N Pavilion Ave
- 114 Delaware Ave
- 702 Delaware Ave