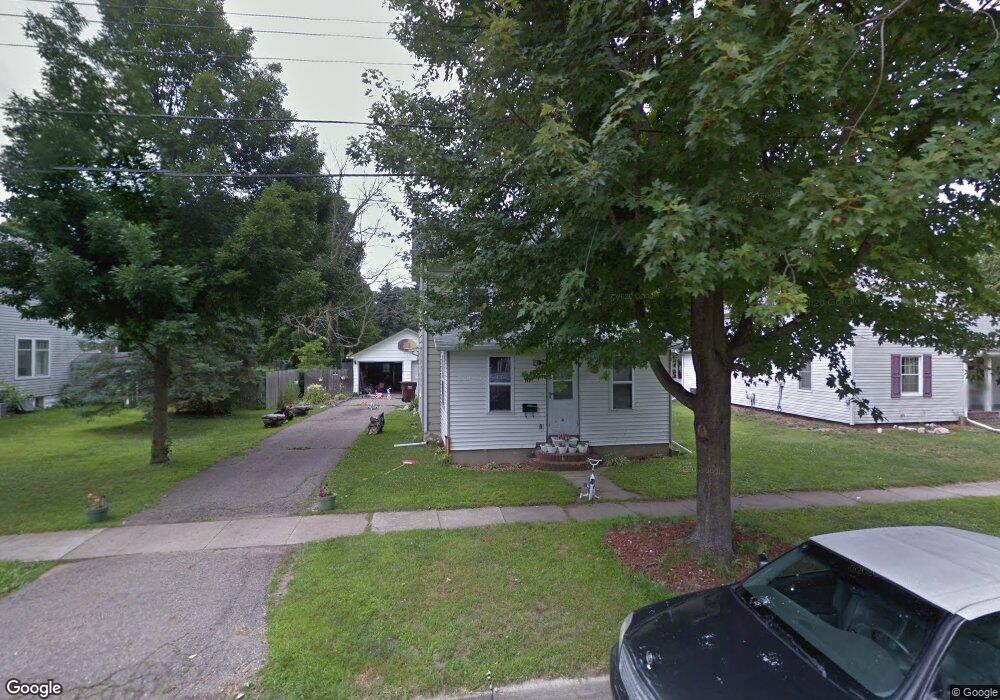
431 Minerva St Eaton Rapids, MI 48827
Estimated Value: $156,000 - $205,000
3
Beds
1
Bath
1,467
Sq Ft
$125/Sq Ft
Est. Value
About This Home
This home is located at 431 Minerva St, Eaton Rapids, MI 48827 and is currently estimated at $183,035, approximately $124 per square foot. 431 Minerva St is a home located in Eaton County with nearby schools including Lockwood Elementary School, Greyhound Intermediate School, and Eaton Rapids Middle School.
Ownership History
Date
Name
Owned For
Owner Type
Purchase Details
Closed on
Mar 22, 2011
Sold by
Eaton Federal Savings Bank
Bought by
Mans Dequan A and Mans Betsie R
Current Estimated Value
Home Financials for this Owner
Home Financials are based on the most recent Mortgage that was taken out on this home.
Original Mortgage
$28,500
Outstanding Balance
$19,857
Interest Rate
5.09%
Mortgage Type
Seller Take Back
Estimated Equity
$163,178
Purchase Details
Closed on
May 6, 2010
Sold by
Main Dale E and Main Barbara J
Bought by
Eaton Federal Savings Bank
Purchase Details
Closed on
Jan 6, 2005
Sold by
Hill Dinordo T
Bought by
Main Dale E and Main Barbara J
Home Financials for this Owner
Home Financials are based on the most recent Mortgage that was taken out on this home.
Original Mortgage
$111,000
Interest Rate
5.83%
Mortgage Type
Purchase Money Mortgage
Create a Home Valuation Report for This Property
The Home Valuation Report is an in-depth analysis detailing your home's value as well as a comparison with similar homes in the area
Home Values in the Area
Average Home Value in this Area
Purchase History
| Date | Buyer | Sale Price | Title Company |
|---|---|---|---|
| Mans Dequan A | $30,000 | None Available | |
| Eaton Federal Savings Bank | $87,221 | None Available | |
| Main Dale E | $108,900 | First American |
Source: Public Records
Mortgage History
| Date | Status | Borrower | Loan Amount |
|---|---|---|---|
| Open | Mans Dequan A | $28,500 | |
| Previous Owner | Main Dale E | $111,000 |
Source: Public Records
Tax History Compared to Growth
Tax History
| Year | Tax Paid | Tax Assessment Tax Assessment Total Assessment is a certain percentage of the fair market value that is determined by local assessors to be the total taxable value of land and additions on the property. | Land | Improvement |
|---|---|---|---|---|
| 2025 | $1,634 | $69,000 | $0 | $0 |
| 2024 | $1,152 | $63,100 | $0 | $0 |
| 2023 | $1,164 | $55,500 | $0 | $0 |
| 2022 | $1,582 | $48,200 | $0 | $0 |
| 2021 | $1,526 | $43,000 | $0 | $0 |
| 2020 | $1,512 | $41,200 | $0 | $0 |
| 2019 | $1,491 | $38,118 | $0 | $0 |
| 2018 | $1,456 | $37,284 | $0 | $0 |
| 2017 | $1,393 | $35,850 | $0 | $0 |
| 2016 | -- | $34,000 | $0 | $0 |
| 2015 | -- | $33,000 | $0 | $0 |
| 2014 | -- | $32,350 | $0 | $0 |
| 2013 | -- | $32,150 | $0 | $0 |
Source: Public Records
Map
Nearby Homes
- 220 Dexter Rd
- 108 Division St
- 518 Clark St
- 329 W Knight St
- 210 Diana St
- 215 E Knight St
- 101 S East St
- 220 S River St
- 100 S Center St
- 500 King St
- 502 S Main St
- 208 Dutton St
- 201 W Broad St
- 502 S East St
- 933 Tyler Dr
- V/L Chester St
- 645 N Gallery Dr Unit 98
- 539 Harwood Ct Unit 134
- 5895 Plains Rd
- 716 Cumberland Dr