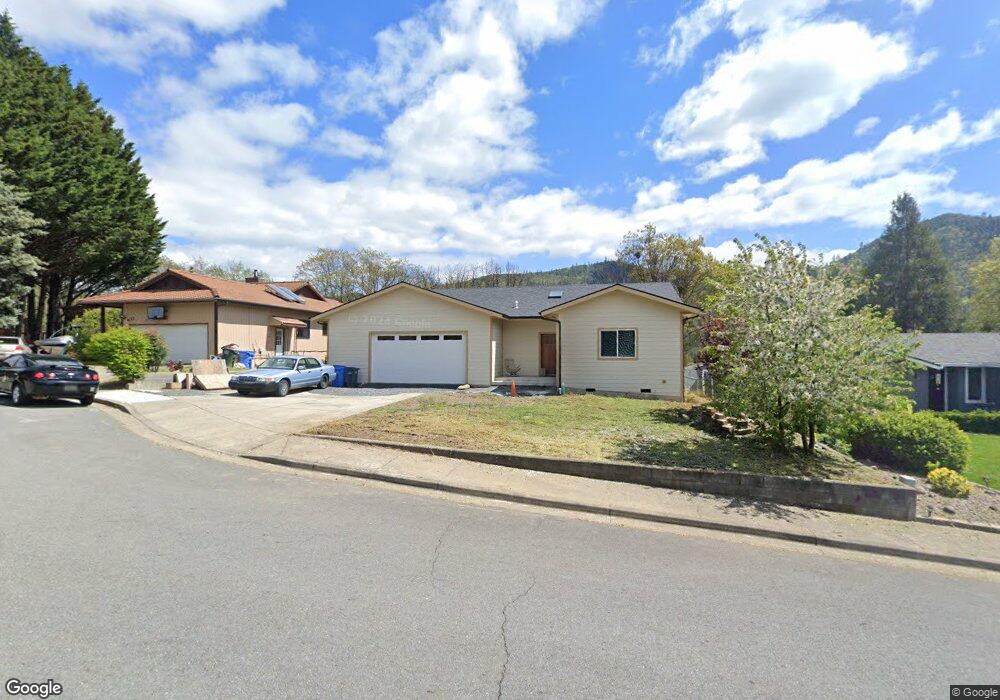
431 Nugget Dr Rogue River, OR 97537
Estimated Value: $394,000 - $474,003
3
Beds
2
Baths
1,144
Sq Ft
$378/Sq Ft
Est. Value
About This Home
This home is located at 431 Nugget Dr, Rogue River, OR 97537 and is currently estimated at $432,751, approximately $378 per square foot. 431 Nugget Dr is a home located in Jackson County with nearby schools including Rogue River Elementary School, South Valley Academy, and Rogue River Junior/Senior High School.
Ownership History
Date
Name
Owned For
Owner Type
Purchase Details
Closed on
Dec 28, 2004
Sold by
Allsman Marc N and Allsman Janet M
Bought by
Allsman Marc N and Allsman Janet M
Current Estimated Value
Purchase Details
Closed on
Aug 11, 2004
Sold by
Bueno Louise
Bought by
Allsman Marc N and Allsman Janet M
Purchase Details
Closed on
Jun 10, 2003
Sold by
Kelly Elizabeth L
Bought by
Bueno Louise
Home Financials for this Owner
Home Financials are based on the most recent Mortgage that was taken out on this home.
Original Mortgage
$50,000
Interest Rate
5.37%
Mortgage Type
Purchase Money Mortgage
Purchase Details
Closed on
Nov 1, 1999
Sold by
Schultz Lloyd Eldon and Schultz Nellie Maud
Bought by
Kelly James G and Kelly Elizabeth L
Create a Home Valuation Report for This Property
The Home Valuation Report is an in-depth analysis detailing your home's value as well as a comparison with similar homes in the area
Home Values in the Area
Average Home Value in this Area
Purchase History
| Date | Buyer | Sale Price | Title Company |
|---|---|---|---|
| Allsman Marc N | -- | Ticor Title | |
| Allsman Marc N | $175,000 | Ticor Title | |
| Bueno Louise | $139,900 | First American | |
| Kelly James G | $125,000 | Crater Title Insurance |
Source: Public Records
Mortgage History
| Date | Status | Borrower | Loan Amount |
|---|---|---|---|
| Previous Owner | Bueno Louise | $50,000 |
Source: Public Records
Tax History Compared to Growth
Tax History
| Year | Tax Paid | Tax Assessment Tax Assessment Total Assessment is a certain percentage of the fair market value that is determined by local assessors to be the total taxable value of land and additions on the property. | Land | Improvement |
|---|---|---|---|---|
| 2025 | $3,559 | $249,220 | $80,570 | $168,650 |
| 2024 | $3,559 | $241,970 | $78,220 | $163,750 |
| 2023 | $1,222 | $83,360 | $75,940 | $7,420 |
| 2022 | $1,193 | $83,360 | $75,940 | $7,420 |
| 2021 | $2,372 | $165,600 | $73,740 | $91,860 |
| 2020 | $2,311 | $160,780 | $71,590 | $89,190 |
| 2019 | $2,256 | $151,560 | $67,490 | $84,070 |
| 2018 | $2,197 | $147,150 | $65,520 | $81,630 |
| 2017 | $2,147 | $147,150 | $65,520 | $81,630 |
| 2016 | $2,093 | $138,710 | $61,760 | $76,950 |
| 2015 | $2,034 | $138,710 | $60,010 | $78,700 |
| 2014 | $1,969 | $130,750 | $56,560 | $74,190 |
Source: Public Records
Map
Nearby Homes
- 105 Brolin Ct
- 305 Woodville Way
- 2661 Wards Creek Rd
- 182 Wards Creek Rd
- 300 Woodville Way
- 904 Broadway St Unit 503
- 5525 Red Tail Ln
- 5500 Red Tail Ln
- 419 E Main St
- 970 Wards Creek Rd
- 0 Oak St
- 111 Cedar St
- TL 1303 E Main St
- 4529 E Evans Creek Rd
- 815 Pine St Unit 10
- 1153 Wards Creek Rd
- 405 Magerle Ln
- 207 Madrone St
- 0 W Evans Creek Rd Unit 1000 220202360
- 0 W Evans Creek Rd Unit 1200 220202358
- 429 Nugget Dr
- 433 Nugget Dr
- 427 Nugget Dr
- 437 Nugget Dr
- 519 Gold Terrace
- 420 Nugget Dr
- 425 Nugget Dr
- 439 Nugget Dr
- 510 Gold Terrace
- 418 Nugget Dr
- 423 Nugget Dr
- 517 Gold Terrace
- 508 Gold Terrace
- 421 Nugget Dr
- 502 Discovery Ln
- 515 Gold Terrace
- 421 Discovery Ln
- 417 Nugget Dr
- 513 Gold Terrace
- 506 Gold Terrace