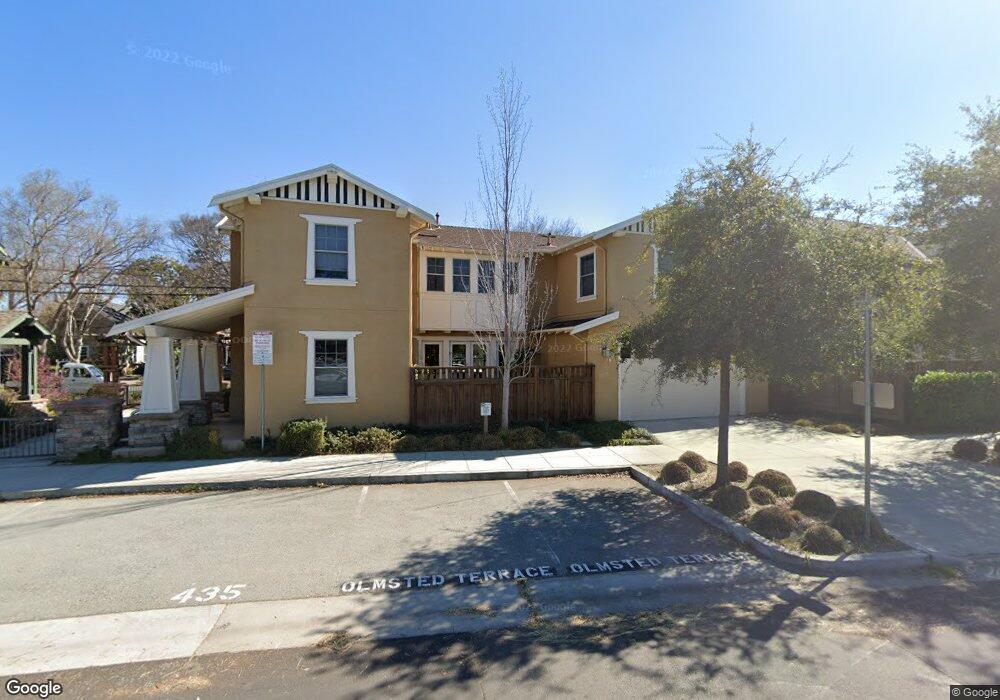
431 Olmsted Rd Stanford, CA 94305
Estimated Value: $1,925,000 - $2,984,451
3
Beds
3
Baths
2,300
Sq Ft
$1,115/Sq Ft
Est. Value
About This Home
This home is located at 431 Olmsted Rd, Stanford, CA 94305 and is currently estimated at $2,563,817, approximately $1,114 per square foot. 431 Olmsted Rd is a home located in Santa Clara County with nearby schools including Escondido Elementary School, Frank S. Greene Jr. Middle, and Palo Alto High School.
Create a Home Valuation Report for This Property
The Home Valuation Report is an in-depth analysis detailing your home's value as well as a comparison with similar homes in the area
Home Values in the Area
Average Home Value in this Area
Tax History Compared to Growth
Tax History
| Year | Tax Paid | Tax Assessment Tax Assessment Total Assessment is a certain percentage of the fair market value that is determined by local assessors to be the total taxable value of land and additions on the property. | Land | Improvement |
|---|---|---|---|---|
| 2025 | $13,319 | $1,070,262 | $576,524 | $493,738 |
| 2024 | $13,319 | $1,049,277 | $565,220 | $484,057 |
| 2023 | $13,117 | $1,028,704 | $554,138 | $474,566 |
| 2022 | $12,960 | $1,008,534 | $543,273 | $465,261 |
| 2021 | $12,694 | $988,760 | $532,621 | $456,139 |
| 2020 | $12,439 | $978,622 | $527,160 | $451,462 |
| 2019 | $12,290 | $959,434 | $516,824 | $442,610 |
| 2018 | $11,961 | $940,623 | $506,691 | $433,932 |
| 2017 | $11,745 | $922,180 | $496,756 | $425,424 |
| 2016 | $11,424 | $904,099 | $487,016 | $417,083 |
| 2015 | $11,293 | $890,520 | $479,701 | $410,819 |
| 2014 | $10,996 | $873,077 | $470,305 | $402,772 |
Source: Public Records
Map
Nearby Homes
- 2131 Harvard St
- 1630 Portola Ave
- 425 Grant Ave Unit 19
- 410 Sheridan Ave Unit 446
- 200 Sheridan Ave Unit 304
- 200 Sheridan Ave Unit 303
- 200 Sheridan Ave Unit 103
- 200 Sheridan Ave Unit 307
- 2573 Park Blvd Unit U204
- 1932 Emerson St
- 125 Lowell Ave
- 184 Tennyson Ave
- 1555 Alma St
- 5 Plan at Acacia
- 4X Plan at Acacia
- 4 Plan at Acacia
- 3 Plan at Acacia
- 2A Plan at Acacia
- 2 Plan at Acacia
- 1 Plan at Acacia
- 427 Olmsted Rd
- 435 Olmsted Rd
- 423 Olmsted Rd
- 439 Olmsted Rd
- 419 Olmsted Rd
- 679 Stanford Ave
- 653 Stanford Ave
- 2000 Williams St
- 641 Stanford Ave
- 613 Stanford Ave
- 2030 Williams St
- 411 Olmsted Rd
- 731 Stanford Ave
- 415 Olmsted Rd
- 2055 Williams St
- 503 Olmsted Rd
- 745 Stanford Ave Unit 3
- 745 Stanford Ave Unit 2
- 745 Stanford Ave Unit 1
- 745 Stanford Ave