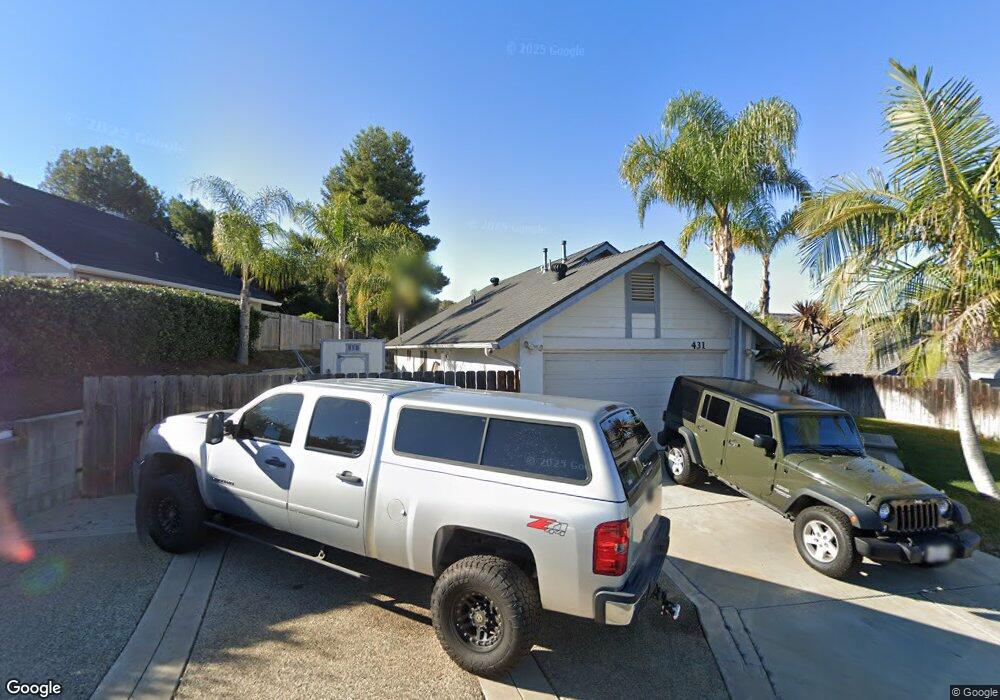
431 Placer Ave San Marcos, CA 92069
Estimated Value: $731,000 - $927,000
3
Beds
2
Baths
1,215
Sq Ft
$660/Sq Ft
Est. Value
About This Home
This home is located at 431 Placer Ave, San Marcos, CA 92069 and is currently estimated at $802,102, approximately $660 per square foot. 431 Placer Ave is a home located in San Diego County with nearby schools including Richland Elementary School, Woodland Park Middle School, and Mission Hills High School.
Ownership History
Date
Name
Owned For
Owner Type
Purchase Details
Closed on
Aug 17, 1999
Sold by
Vanlaar Larry A and Vanlaar Lisa R
Bought by
Espinoza Rick
Current Estimated Value
Home Financials for this Owner
Home Financials are based on the most recent Mortgage that was taken out on this home.
Original Mortgage
$133,600
Outstanding Balance
$38,122
Interest Rate
7.56%
Estimated Equity
$763,980
Purchase Details
Closed on
Dec 19, 1986
Create a Home Valuation Report for This Property
The Home Valuation Report is an in-depth analysis detailing your home's value as well as a comparison with similar homes in the area
Home Values in the Area
Average Home Value in this Area
Purchase History
| Date | Buyer | Sale Price | Title Company |
|---|---|---|---|
| Espinoza Rick | $167,000 | Chicago Title Co | |
| -- | $100,500 | -- |
Source: Public Records
Mortgage History
| Date | Status | Borrower | Loan Amount |
|---|---|---|---|
| Open | Espinoza Rick | $133,600 | |
| Closed | Espinoza Rick | $16,700 |
Source: Public Records
Tax History Compared to Growth
Tax History
| Year | Tax Paid | Tax Assessment Tax Assessment Total Assessment is a certain percentage of the fair market value that is determined by local assessors to be the total taxable value of land and additions on the property. | Land | Improvement |
|---|---|---|---|---|
| 2025 | $2,801 | $256,645 | $99,599 | $157,046 |
| 2024 | $2,801 | $251,614 | $97,647 | $153,967 |
| 2023 | $2,748 | $246,682 | $95,733 | $150,949 |
| 2022 | $2,710 | $241,846 | $93,856 | $147,990 |
| 2021 | $2,665 | $237,105 | $92,016 | $145,089 |
| 2020 | $2,640 | $234,675 | $91,073 | $143,602 |
| 2019 | $2,610 | $230,075 | $89,288 | $140,787 |
| 2018 | $2,528 | $225,565 | $87,538 | $138,027 |
| 2017 | $133 | $221,143 | $85,822 | $135,321 |
| 2016 | $2,439 | $216,808 | $84,140 | $132,668 |
| 2015 | $2,404 | $213,553 | $82,877 | $130,676 |
| 2014 | $2,350 | $209,371 | $81,254 | $128,117 |
Source: Public Records
Map
Nearby Homes
- 560 Moonlight Dr
- 303 Mission Villas Rd
- 516 Moonlight Dr
- 209 Mission Villas Rd
- 173 Mission Villas Rd
- 460 Chardonnay Ct
- 500 Rancheros Dr Unit 191
- 500 Rancheros Dr Unit 181
- 500 Rancheros Dr Unit 58
- 139 Avenida Chapala Unit 106
- 734 Brass Lantern Rd
- 823 Orla St
- 908 Lantana Ct
- 425 Autumn Dr Unit 25
- 217 Westlake Dr Unit 6
- 1366 Topanga Dr
- 414 W San Marcos Blvd Unit 130
- 275 Richland Rd
- 422 W San Marcos Blvd Unit 153
- 679 Glasgow Ct